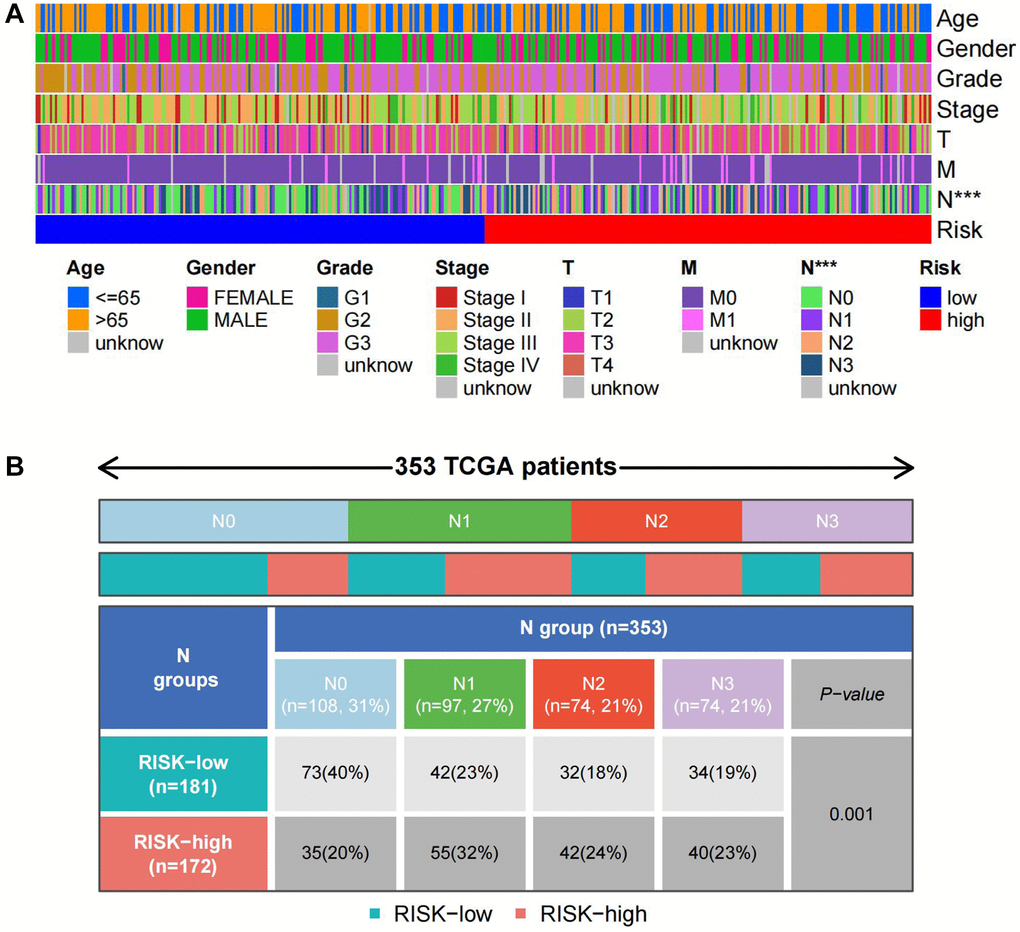
Figure 7.Distribution of TSRS in different pathological parameters. (A) Clinical heat map of clinicopathological parameters and TSRS. (B) Clinical heat map of N and TSRS.
Figure 7 — Machine learning for identifying tumor stemness genes and developing prognostic model in gastric cancer | Aging