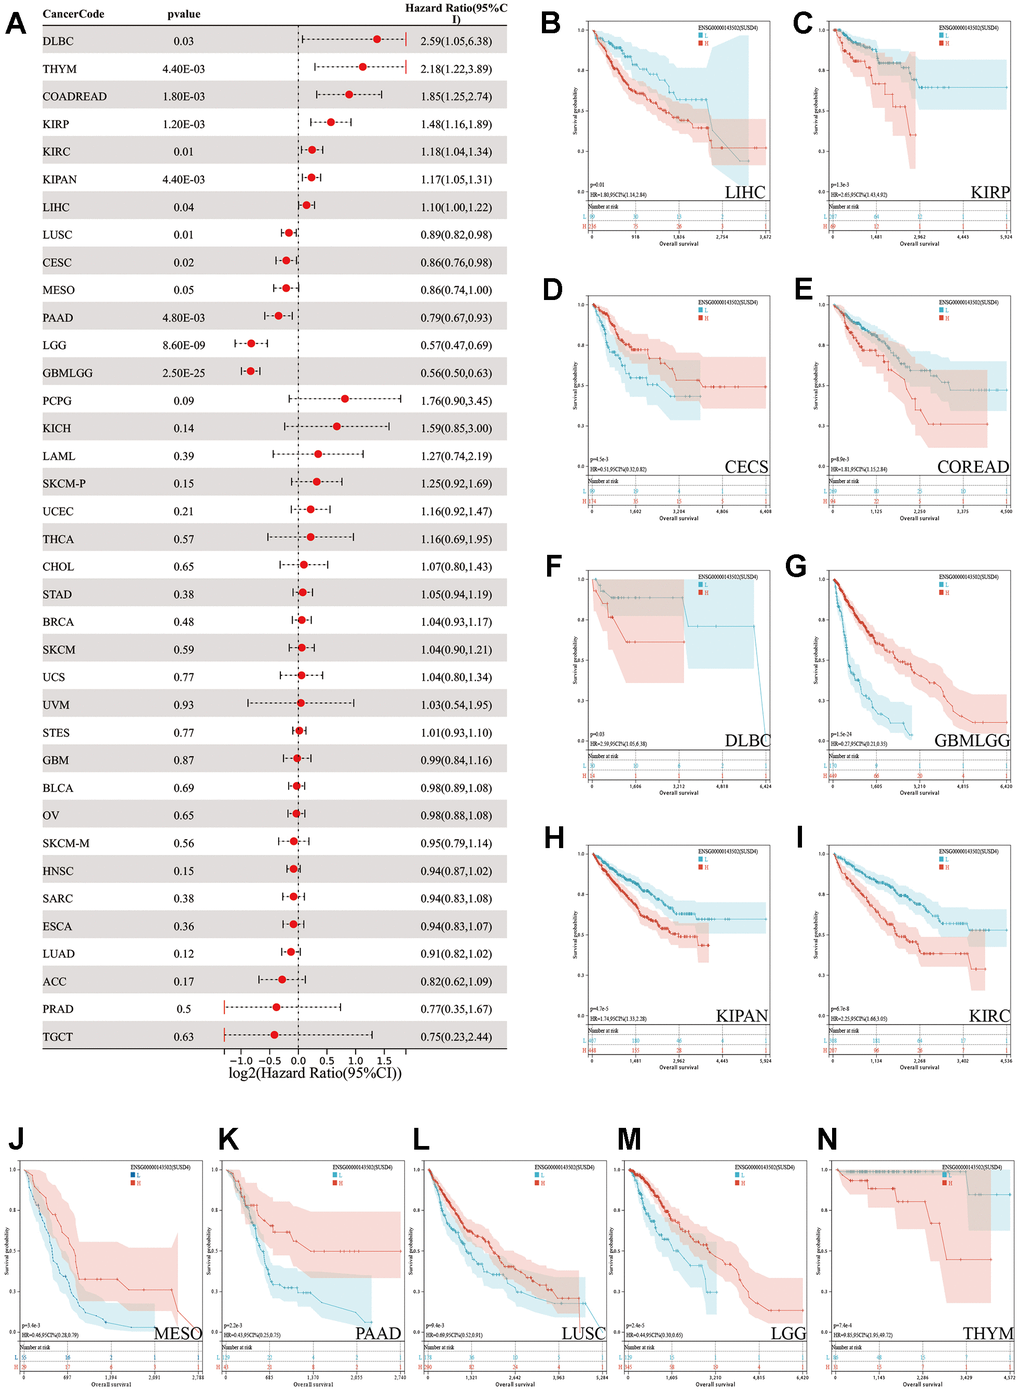
Figure 2.Pan-cancer survival analysis of SUSD4. (A) Forest plot of the pan-cancer survival analysis. (B–N) The Kaplan-Meier plot of TCGA pan-cancer survival profiles with significant differences. The red and blue line represents high and low SUSD4 expression group respectively. HR, hazard radio. CI, confidence interval.