Submit an Article
Navigate
Home
Editorial Board
Editorial Policies
Current Volume
Archive
Scientific Integrity
Publication Ethics Statements
Interviews with Outstanding Authors
Newsroom
Sponsored Conferences
Podcast
Contact
Special Collections
Submit an Article
Online ISSN: 1945-4589
Research Paper
|
Volume 16, Issue 7
|
pp. 6163–6187
KIF3C: an emerging biomarker with prognostic and immune implications across pan-cancer types and its experiment validation in gastric cancer
Back to article
Figure 2
(3 of 13)
−
100%
+
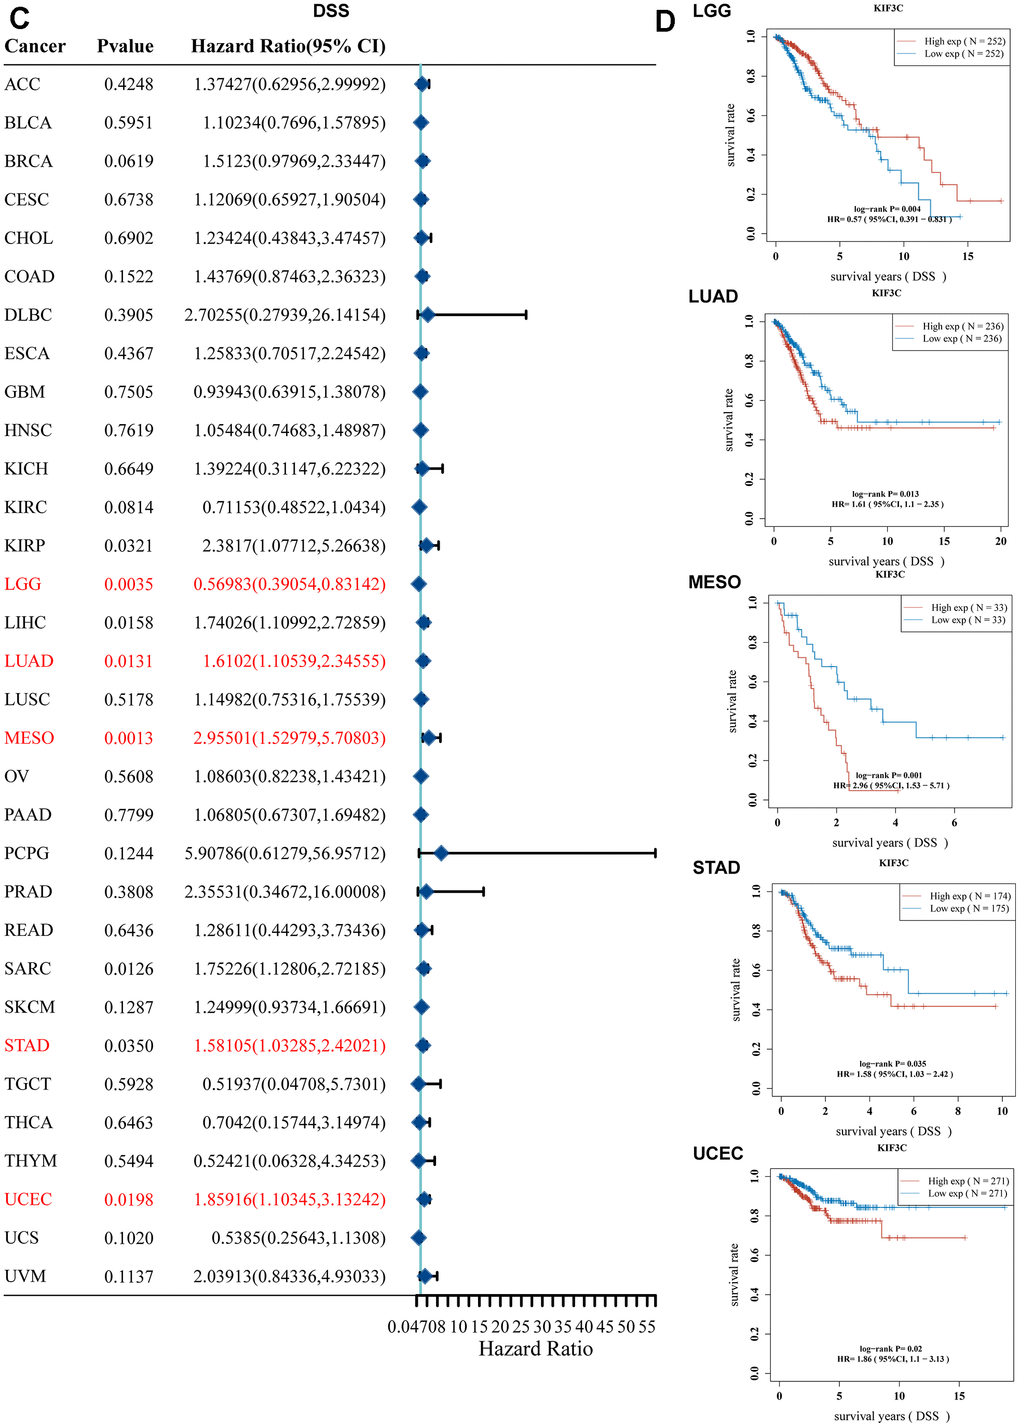
Figure 2.
Correlation between KIF3C expression and survival prognosis.
(
C
) Forest plot of DSS correlation in TCGA. (
D
) Kaplan-Meier analysis of the correlation between KIF3C and DSS.