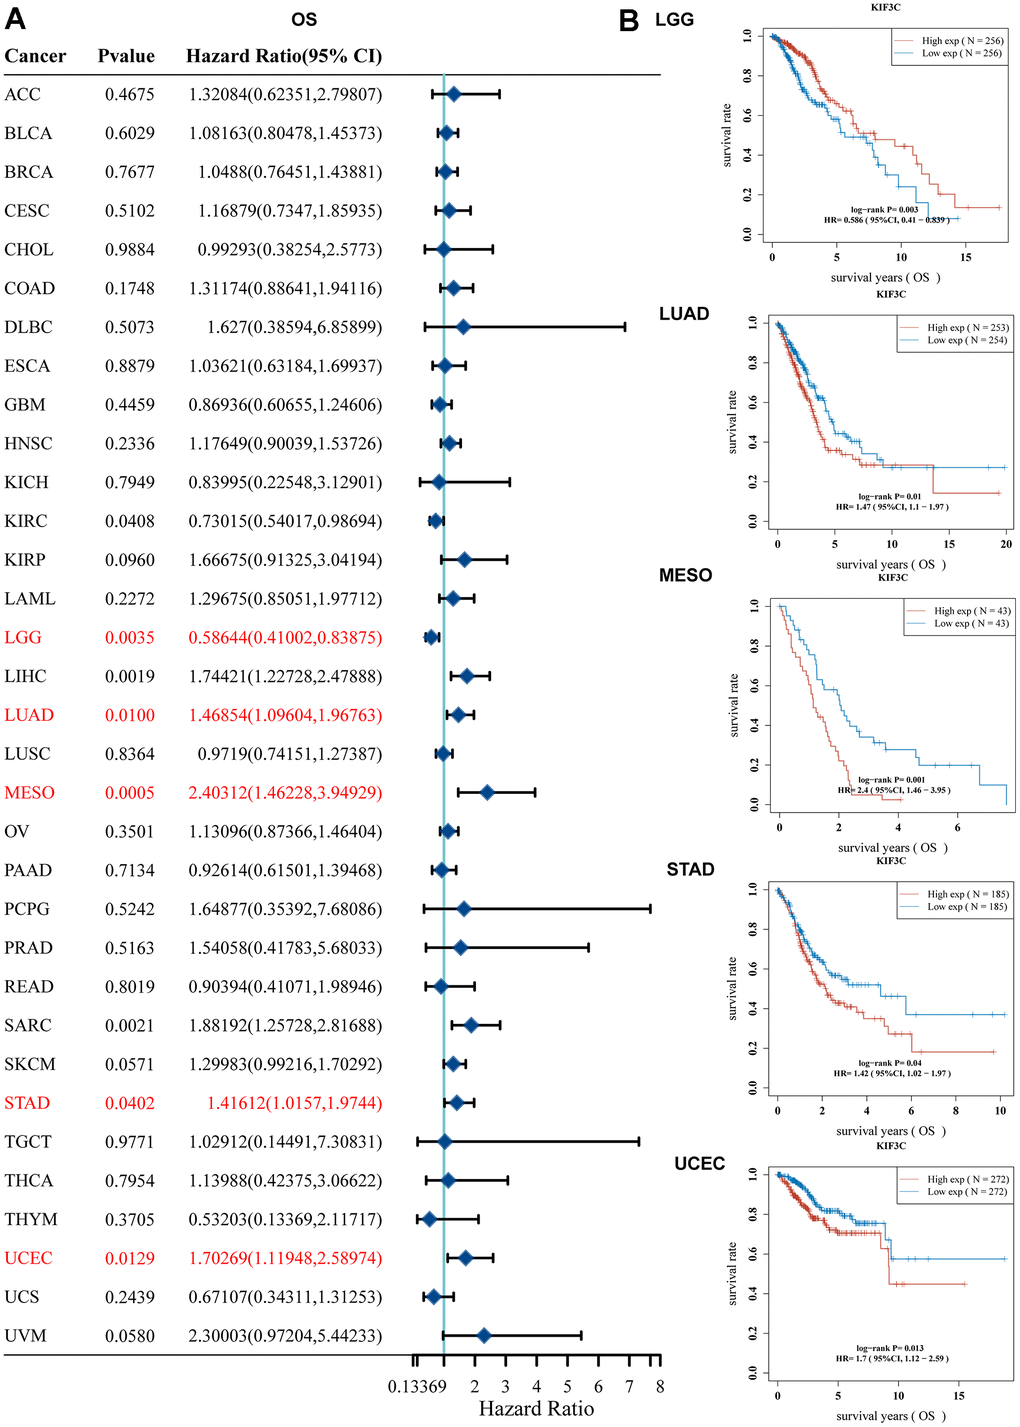
Figure 2.Correlation between KIF3C expression and survival prognosis. (A) Forest plot of OS correlation in TCGA. (B) Kaplan-Meier analysis of the correlation between KIF3C and OS.
(C) Forest plot of DSS correlation in TCGA. (D) Kaplan-Meier analysis of the correlation between KIF3C and DSS.
(E) Forest plot of PFS correlation in TCGA. (F) Kaplan-Meier analysis of the correlation between KIF3C and PFS.