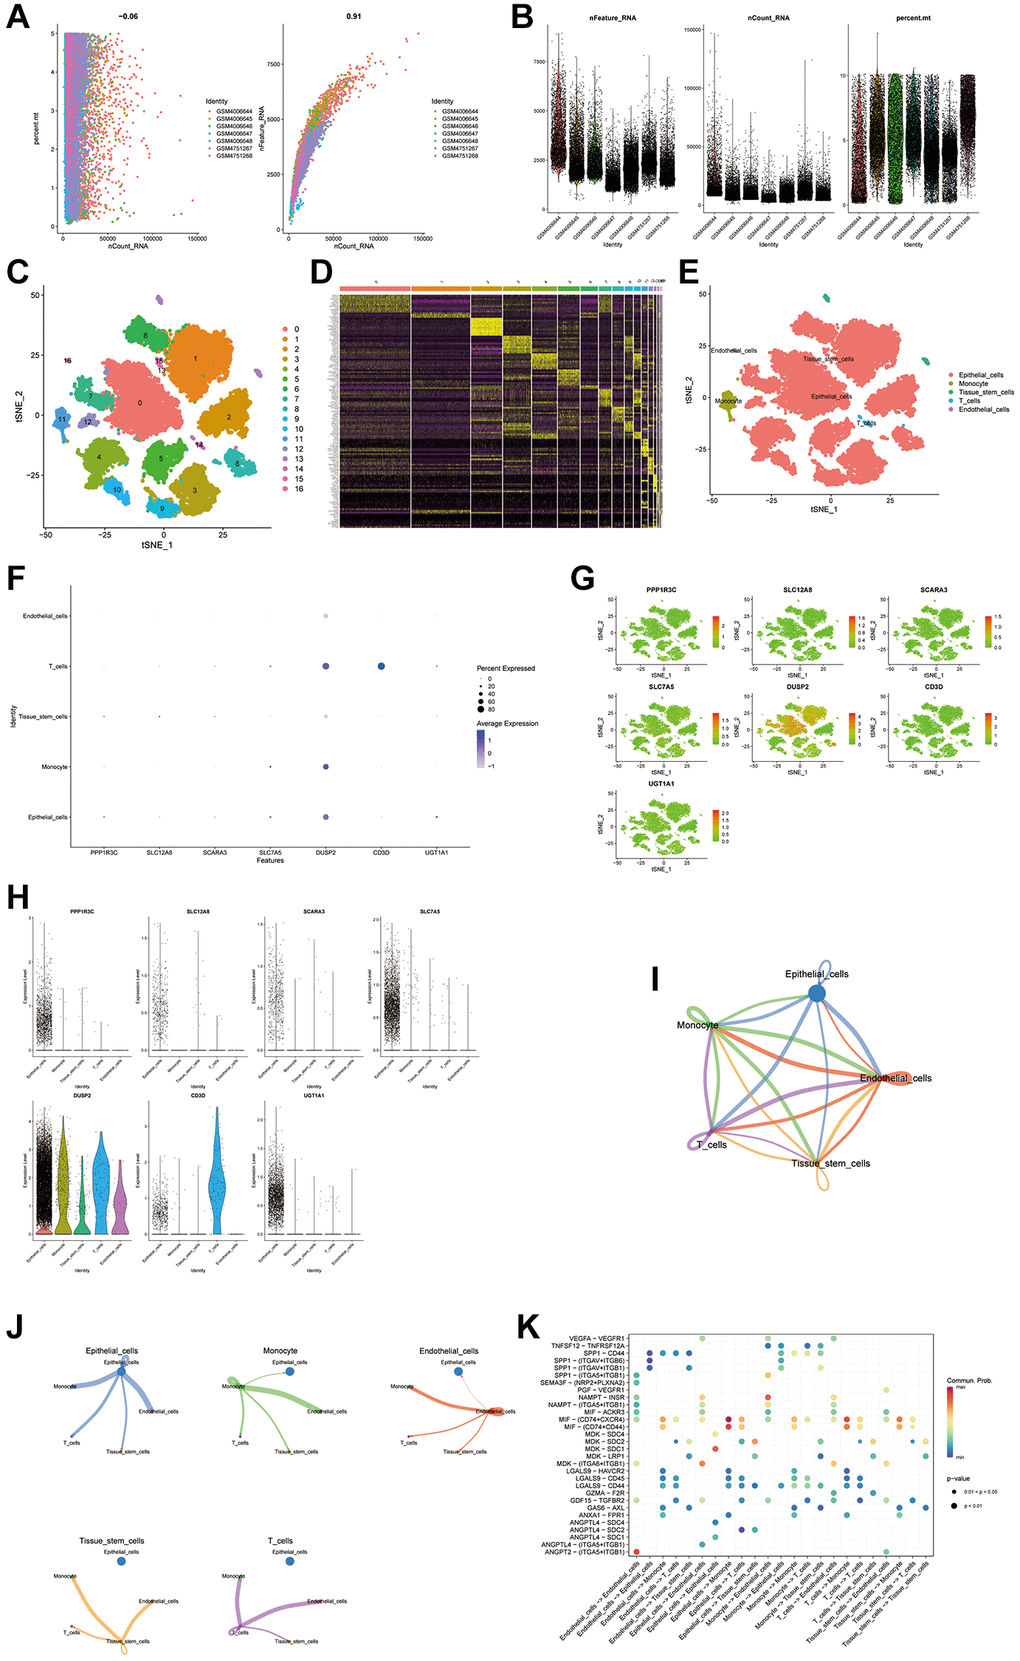
Figure 9.scRNA seq analysis. (A, B) Performing gene filtering, normalization, principal component analysis of scRNA seq data. (C–E) Annotation of all cell types in GSE135337 and the percentage of each cell type. (F–H) Expression of the genes in each cell type. (I–K) Cell to cell communications between each cell type.