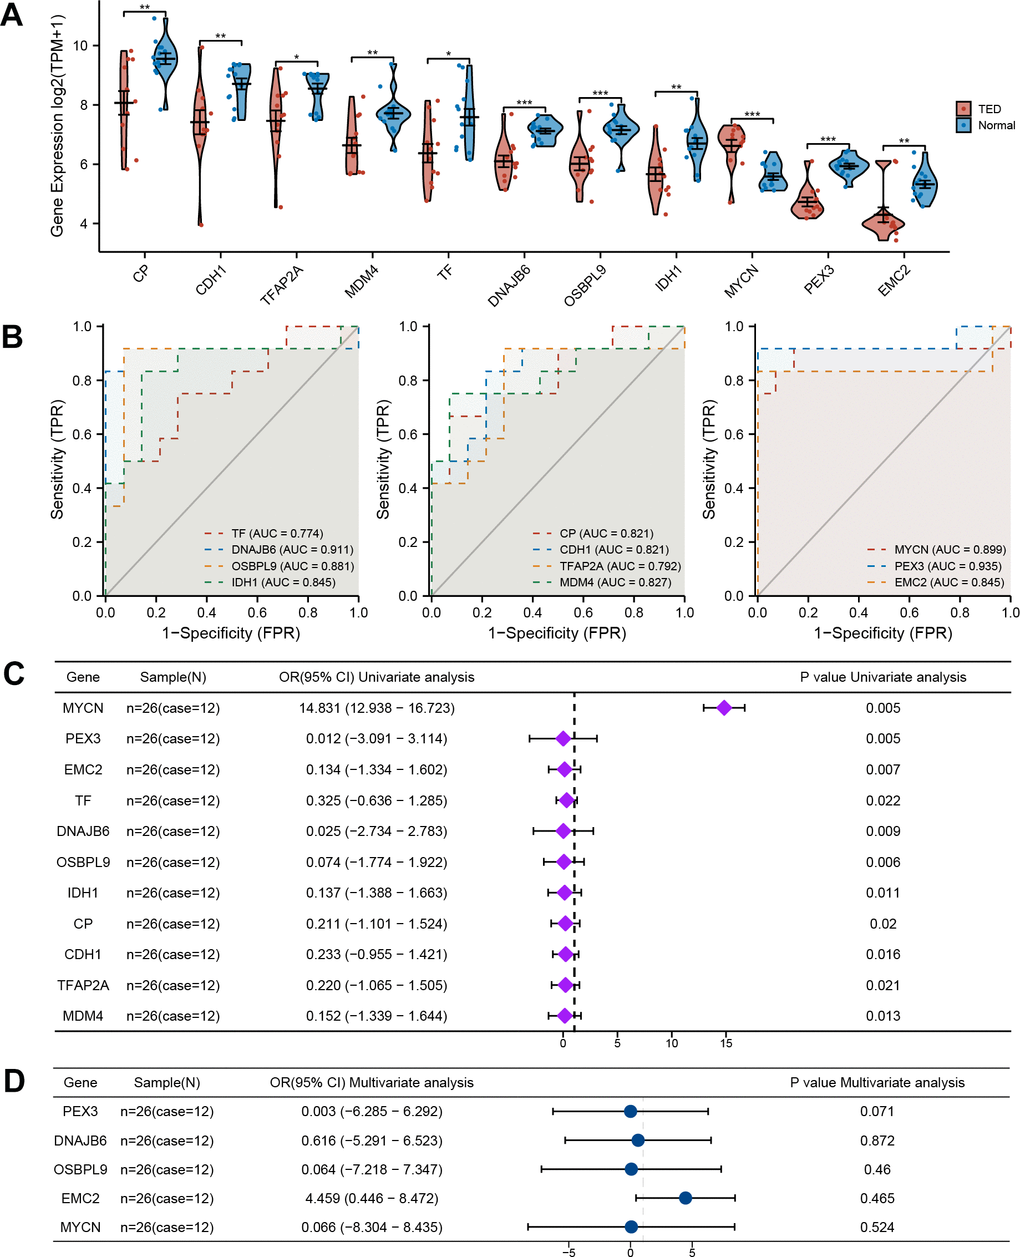
Figure 3.Comprehensive evaluation of F-DEGs. (A) Gene expression analysis of F-DEGs between TED and normal groups; (B) Diagnostic value analysis of F-DEGs; (C) Univariate analysis of F-DEGs; (D) Multivariate analysis of F-DEGs. *P < 0.05, **P < 0.01, ***P < 0.001.