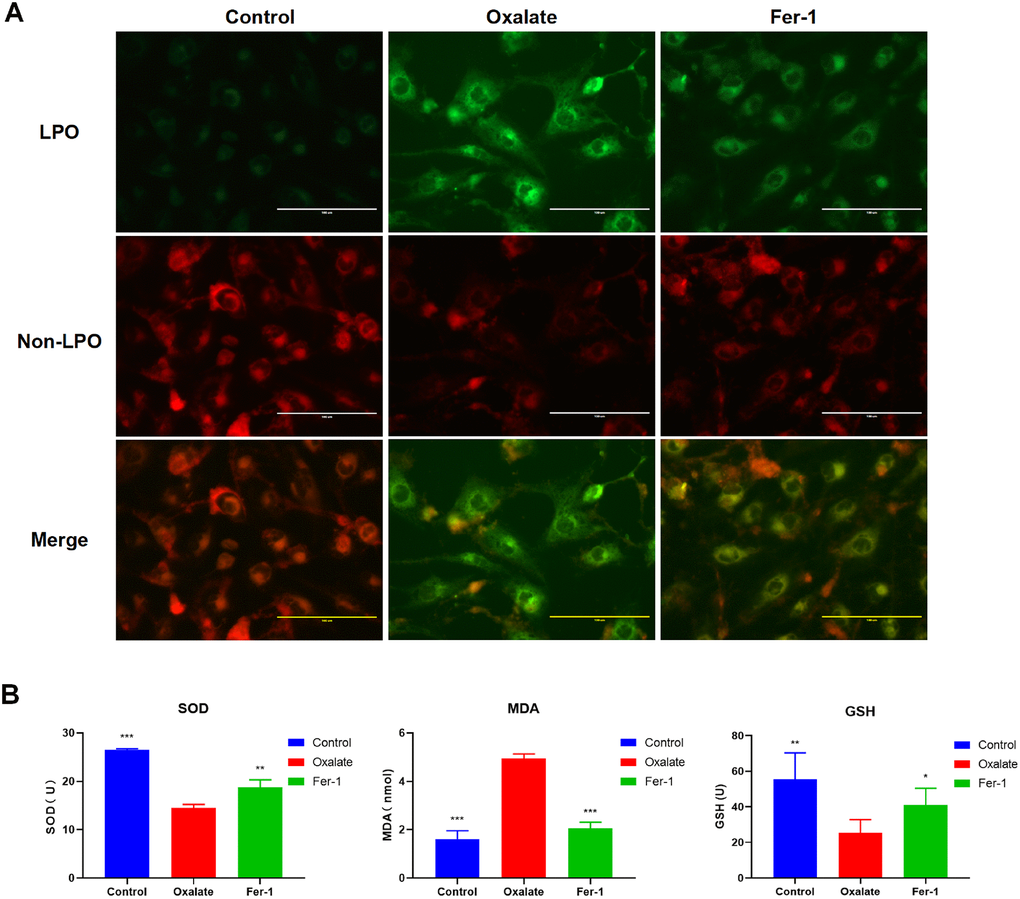
Figure 8.Fer-1 suppresses oxalate-induced cytotoxicity and LPO in HK-2 cells. (A) Measuring cellular LPO with the C11 BODIPY 581/591 fluorescent probe in HK-2 cells with different treatment (magnification×40; scale bar, 100 μm). (B) SOD, MDA, and GSH activity are detected in HK-2 cells with different treatment (mean ± SD, n = 3, *P < 0.05, **P < 0.01, ***P < 0.001, compared with Oxalate group).