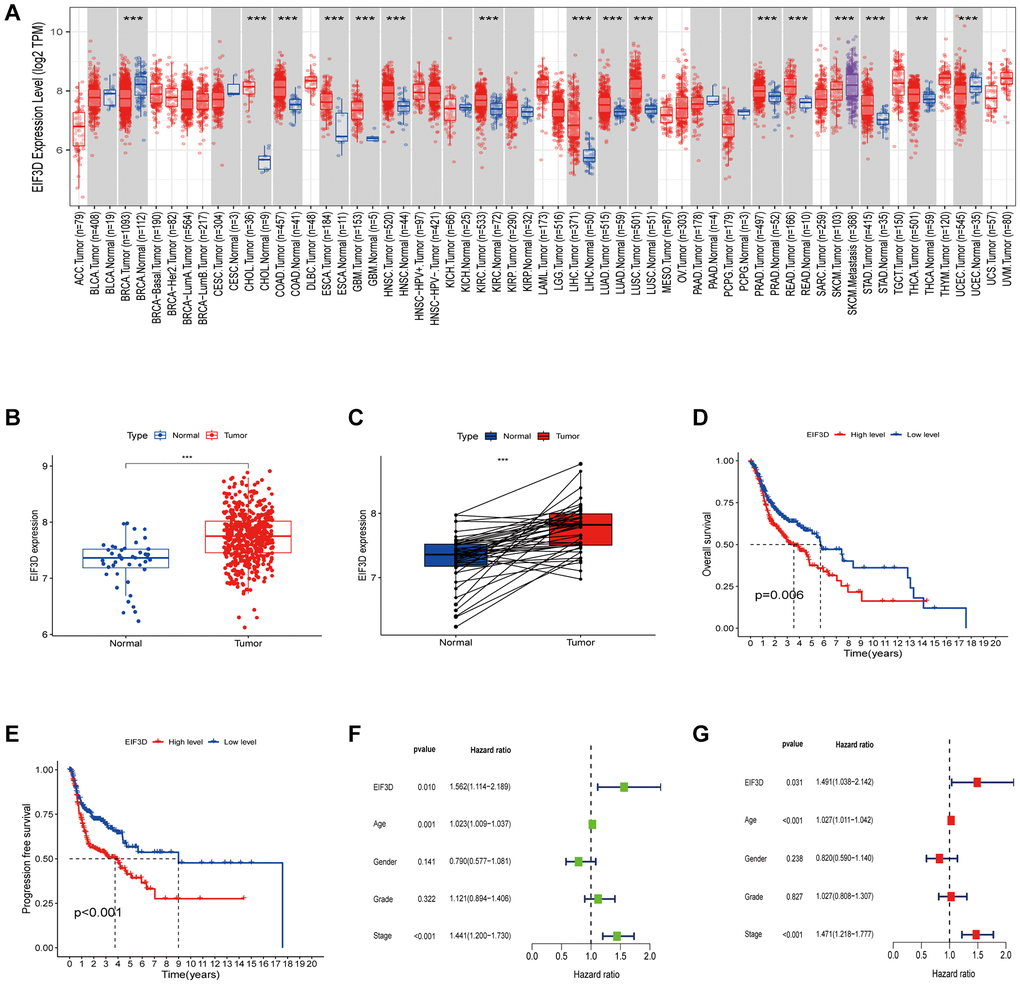
Figure 1.Expression level and prognosis of EIF3D in HNSC. (A) Box plot illustrating the expression level of EIF3D in pan-cancer dataset. (B, C) Box plots displaying EIF3D expression levels in a cohort of 566 HNSC samples retrieved from the TCGA database, encompassing 522 tumor samples and 44 normal samples. Error bars indicate the mean ± SEM. Significance denoted by P < 0.05. (D, E) Survival curves depicting the impact of EIF3D expression on HNSC patient survival, as determined from the TCGA databases. (F, G) Univariate and multivariate Cox regression analyses. Significance levels: *P-value < 0.05, **P-value < 0.01, ***P-value < 0.001.