Submit an Article
Navigate
Home
Editorial Board
Editorial Policies
Current Volume
Archive
Scientific Integrity
Publication Ethics Statements
Interviews with Outstanding Authors
Newsroom
Sponsored Conferences
Podcast
Contact
Special Collections
Submit an Article
Online ISSN: 1945-4589
Research Paper
|
Volume 16, Issue 6
|
pp. 5676–5702
Identification and validation of a novel signature based on macrophage marker genes for predicting prognosis and drug response in kidney renal clear cell carcinoma by integrated analysis of single cell and bulk RNA sequencing
Back to article
Figure 5
(5 of 12)
−
100%
+
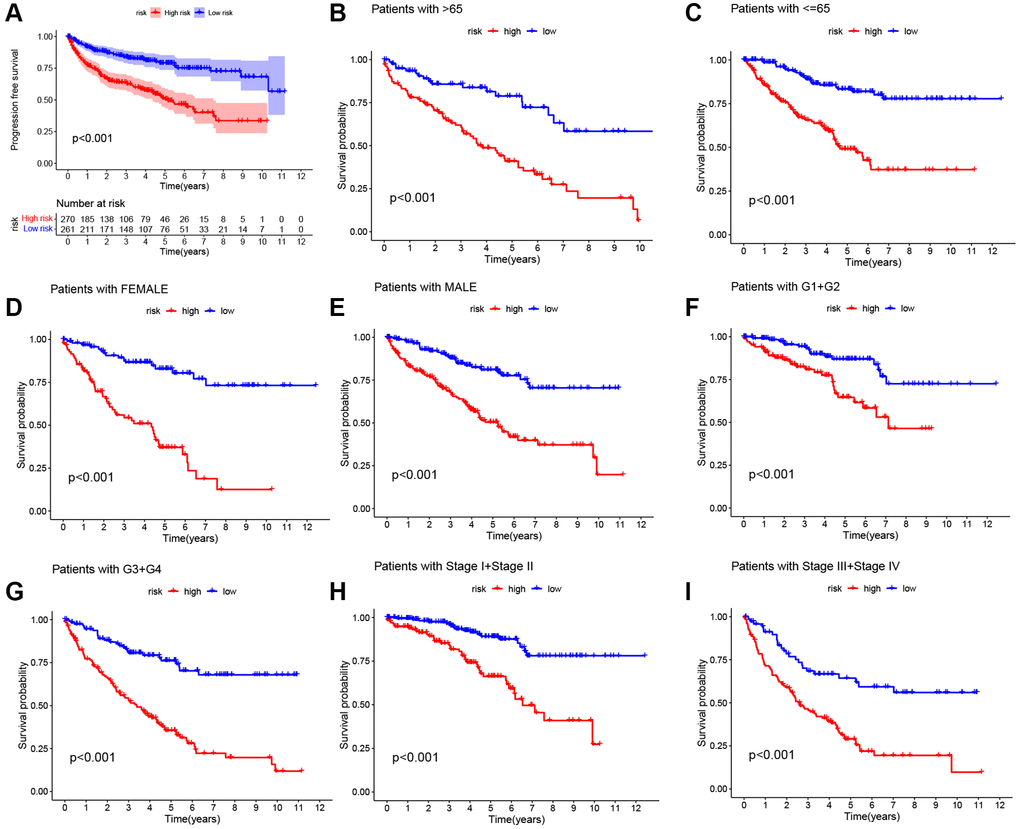
Figure 5.
Kaplan-Meier survival curves for two risk cohorts with different clinical characteristics.
(
A
) Progression free survival. (
B
,
C
) Age. (
D
,
E
) Sex. (
F
,
G
) Grade. (
H
,
I
) Stage.