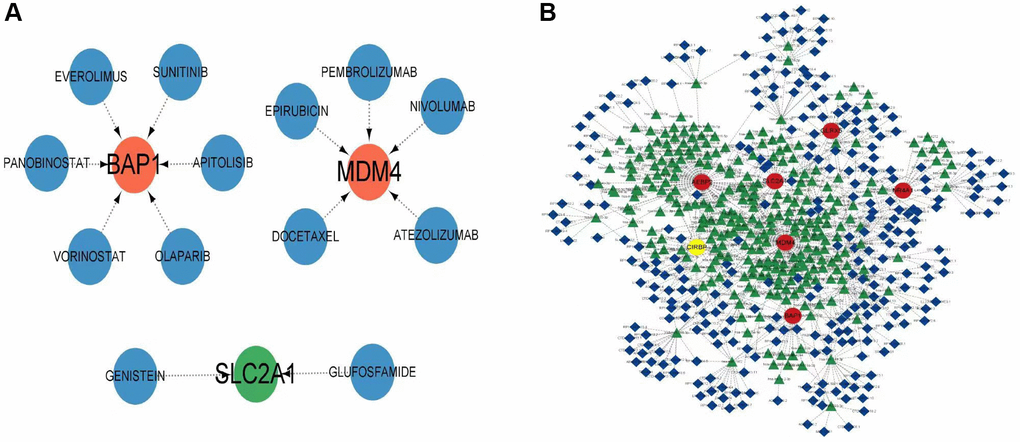
Figure 8.Construction of competing endogenous RNA (ceRNA) network and regulation by drugs. (A) Drug regulatory network of model genes. (B) The ceRNA network associated with model genes. Up-regulated entities are indicated in red, while down-regulated entities are indicated in yellow.