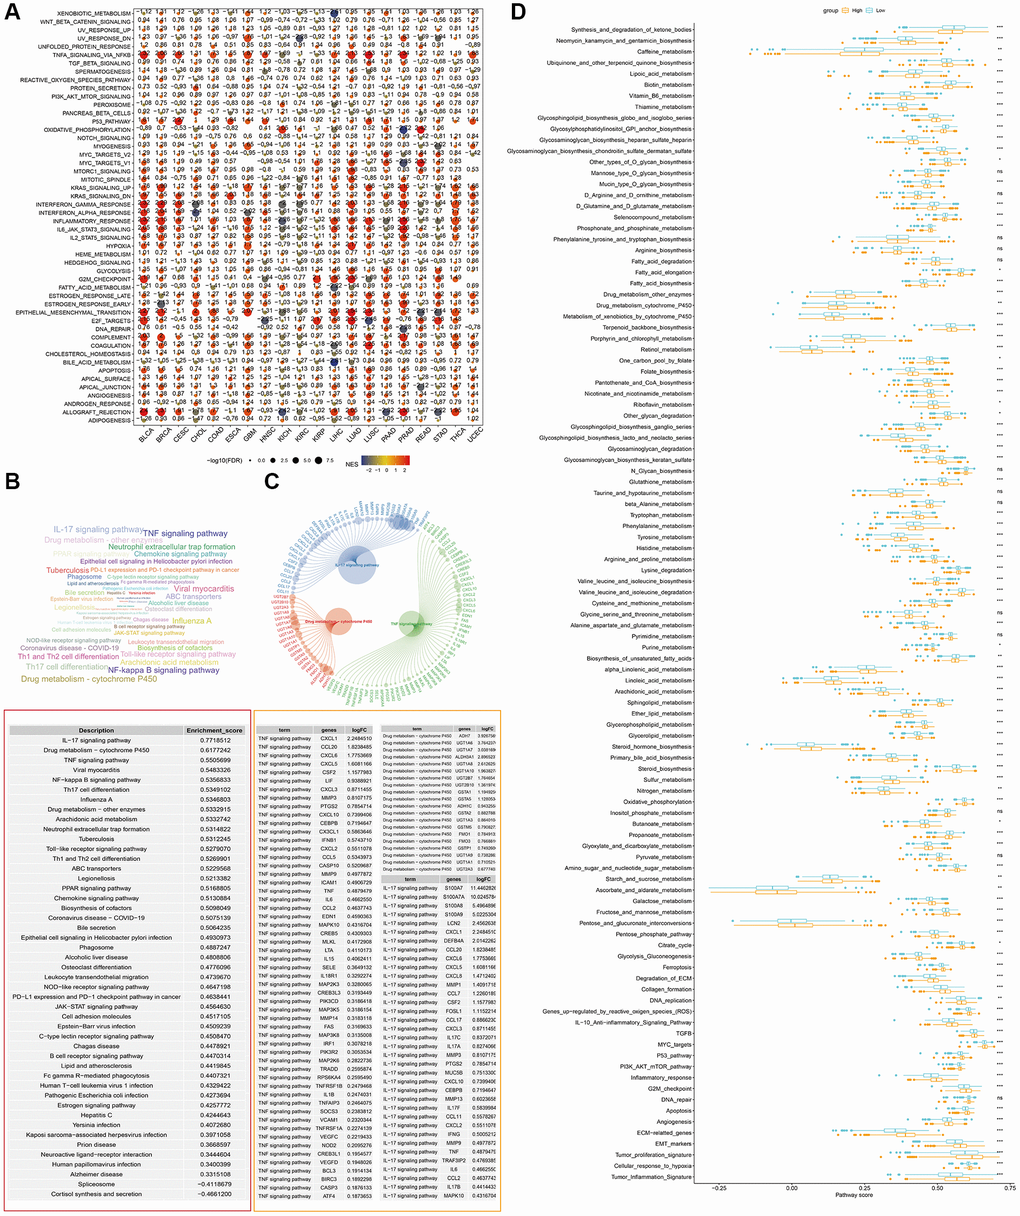
Figure 3.GSEA of DEGs between S100A7-high and -low expression groups pan-cancer. (A) Pan-cancer GSEA. (B) The GSEA results in breast cancer were shown using a word cloud map. (C) Top three potential pathways according to GSEA results in breast cancer. (D) Pathway score in the S100A7-high and -low expression groups in breast cancer. Abbreviations: GSEA: Gene Set Enrichment Analysis; DEGs: differentially expressed genes.