Submit an Article
Navigate
Home
Editorial Board
Editorial Policies
Current Volume
Archive
Scientific Integrity
Publication Ethics Statements
Interviews with Outstanding Authors
Newsroom
Sponsored Conferences
Podcast
Contact
Special Collections
Submit an Article
Online ISSN: 1945-4589
Research Paper
|
Volume 16, Issue 6
|
pp. 5545–5566
A pyrimidine metabolism-related signature for prognostic and immunotherapeutic response prediction in hepatocellular carcinoma by integrating analyses
Back to article
Figure 5
(5 of 12)
−
100%
+
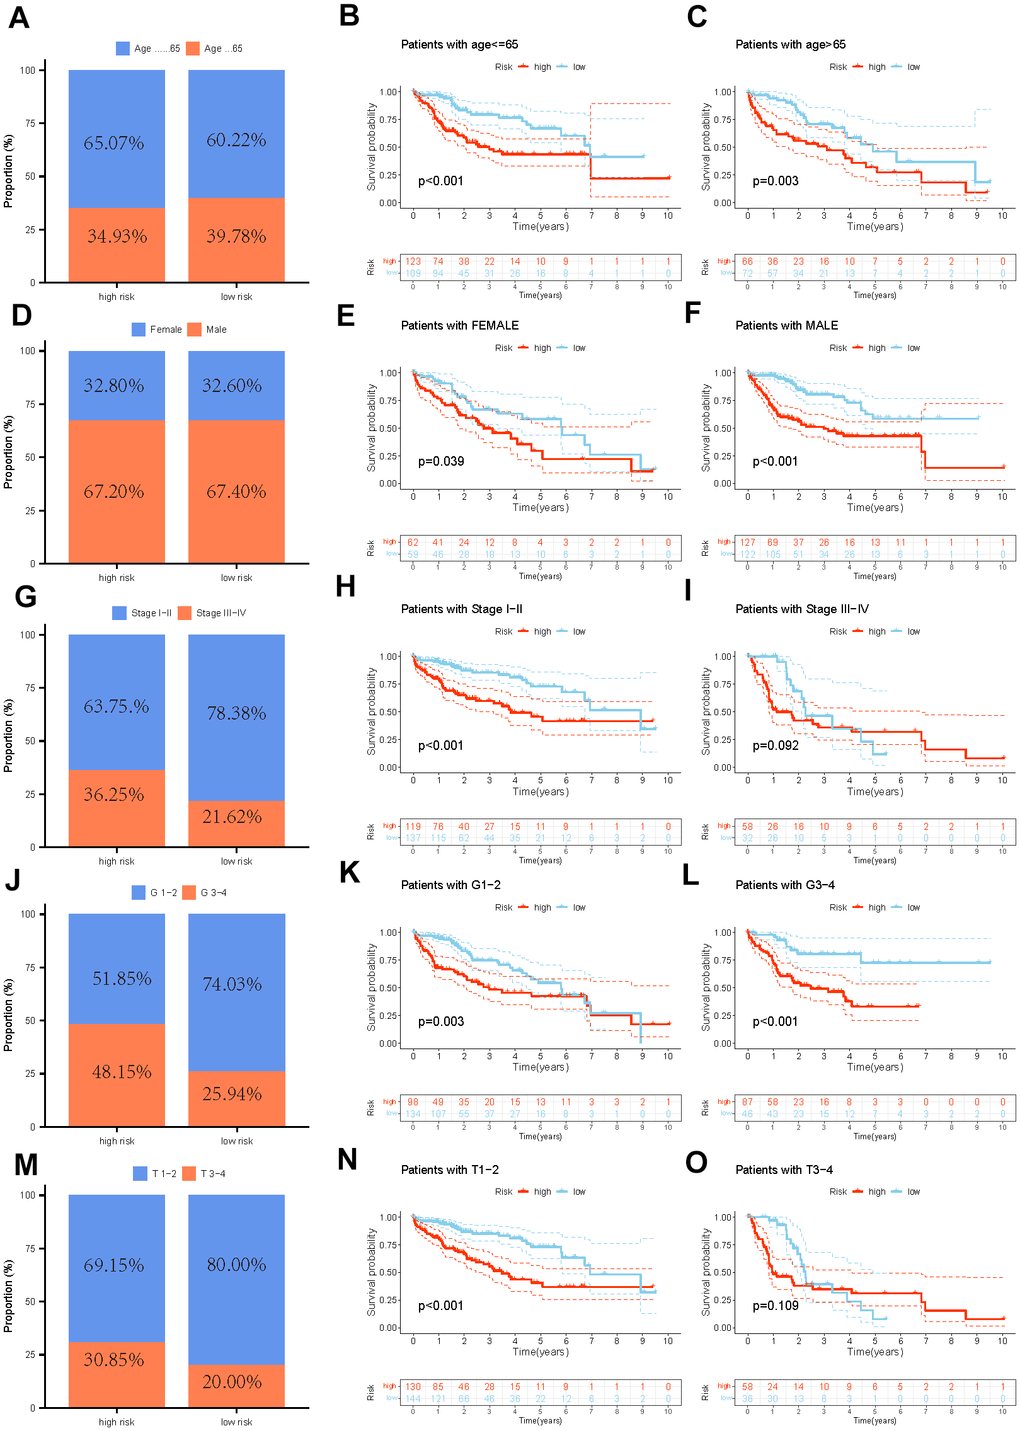
Figure 5.
The distribution features and the OS KM curve of various clinicopathological factors in different risk groups.
(
A
–
C
) Age, (
D
–
F
) Gender, (
G
–
I
) Grade, (
J
–
L
) Stage, (
M
–
O
) T.