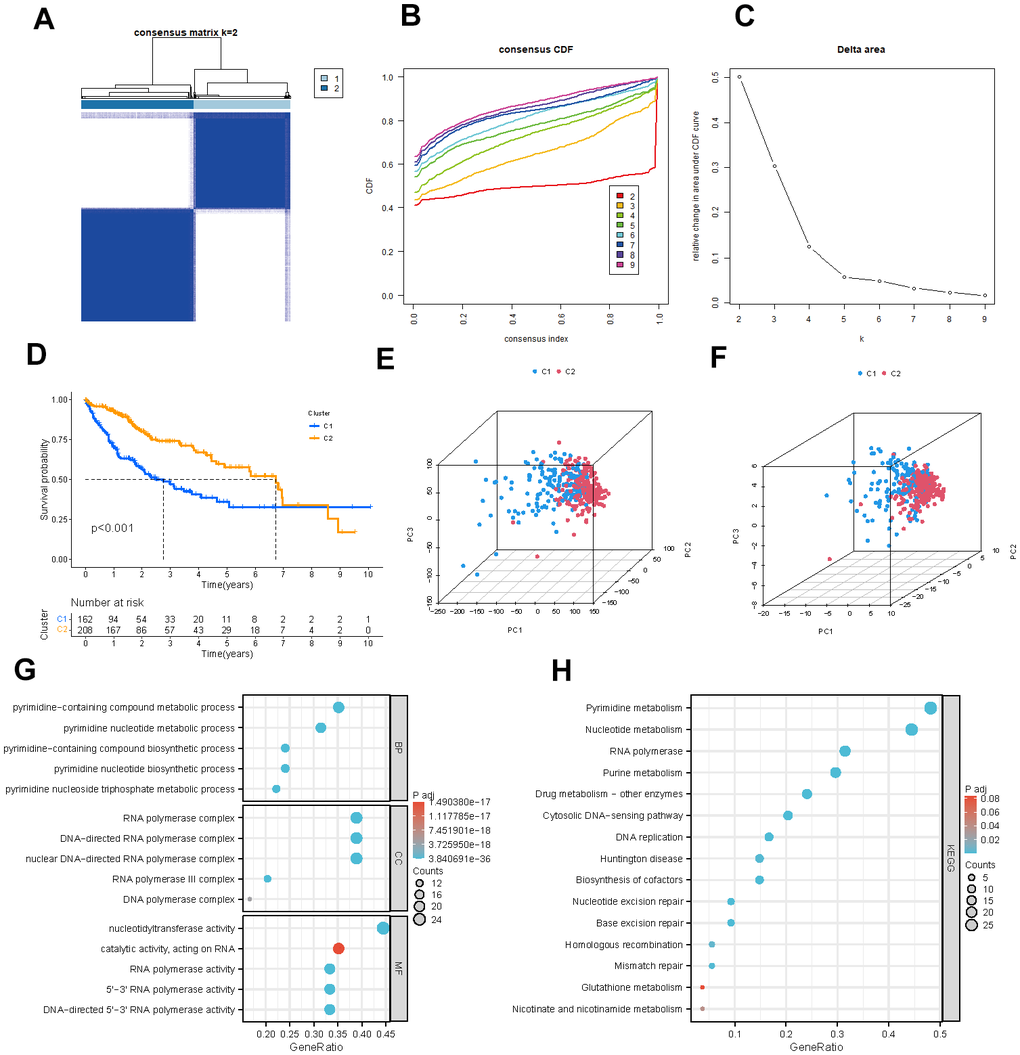
Figure 3.Identification of potential pyrimidine metabolism-related clusters in HCC patients. (A) The consensus clustering analysis of PMRGs. (B) Consensus CDF. (C) Delta area. (D) Kaplan-Meier survival analysis for different clusters. (E, F) The PCA plots of the PMRG clusters. (G, H) GO and KEGG enrichment analysis of differentially expressed PMRGs.