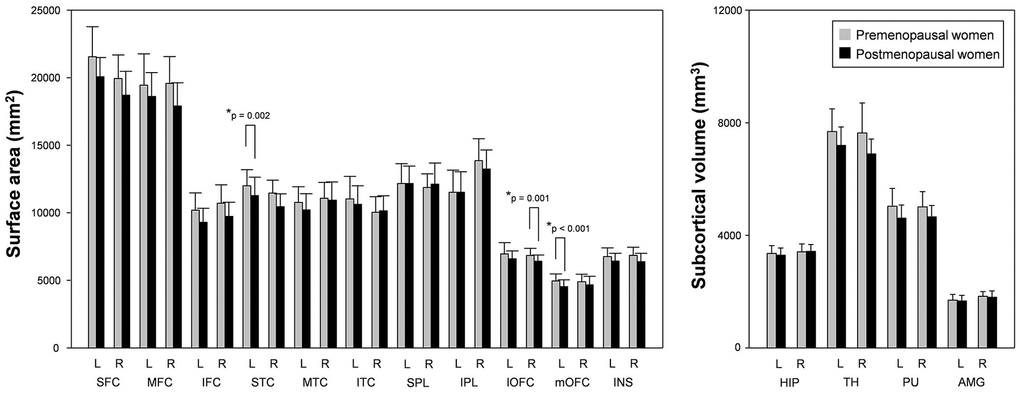
Figure 3.Surface areas and subcortical volumes in postmenopausal women and premenopausal women. Postmenopausal women showed significantly reduced surface areas of the left mOFC, right lOFC, and right STC compared to premenopausal women. L; left, R: right, SFC/MFC/IFC; superior/middle/inferior frontal cortex, STC/MTC/ITC; superior/middle/inferior temporal cortex, SPL/IPL; superior/inferior parietal lobule, lOFC/mOFC; lateral/medial orbitofrontal cortex, INS; insula, HIP; hippocampus, TH; thalamus, PU; putamen, AMG; amygdala. *Meet Bonferroni-corrected significance level.