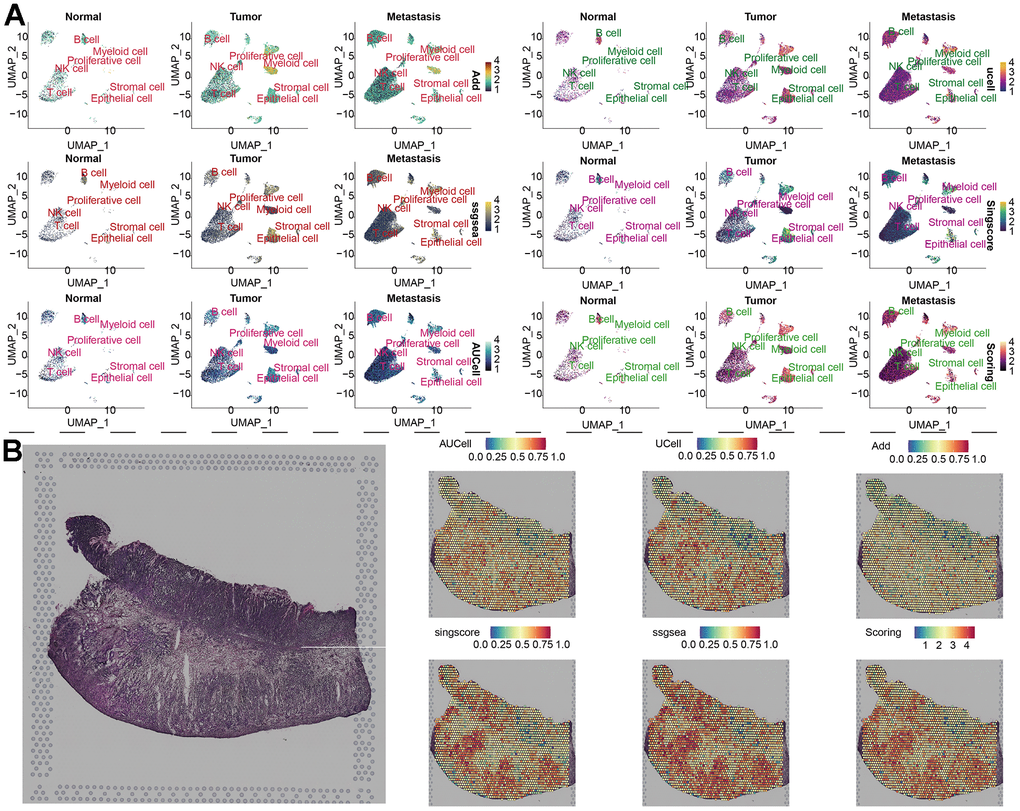
Figure 4.Distribution of parthanatos scores in single-cell atlas and spatial resolution. (A) Based on the UMAP algorithm, the gene set scores of 7 cell clusters were displayed in the combined samples (including normal tissue, tumor tissue and metastatic tissue). (B) Spatial transcriptome data of GC, gene set scoring under 6 gene set scoring algorithms.