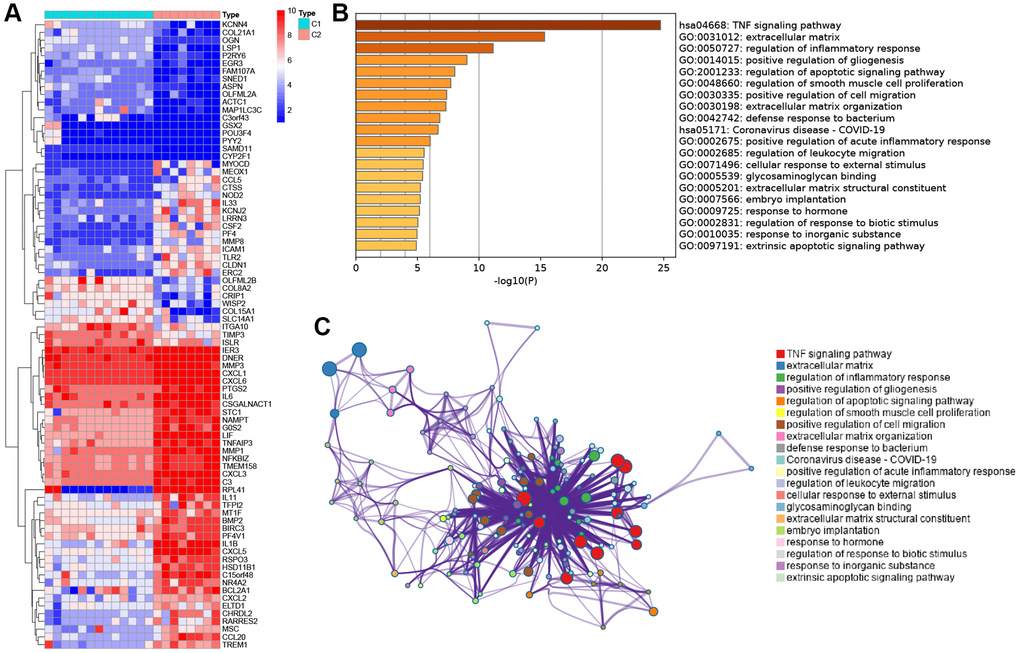
Figure 3.Functional enrichment analysis between the two subtypes. (A) Heatmap showing differentially expressed genes in the C1 and C2. (B) Functional enrichment of biological process and KEGG pathway. (C) Network diagram of gene functional enrichment analysis.