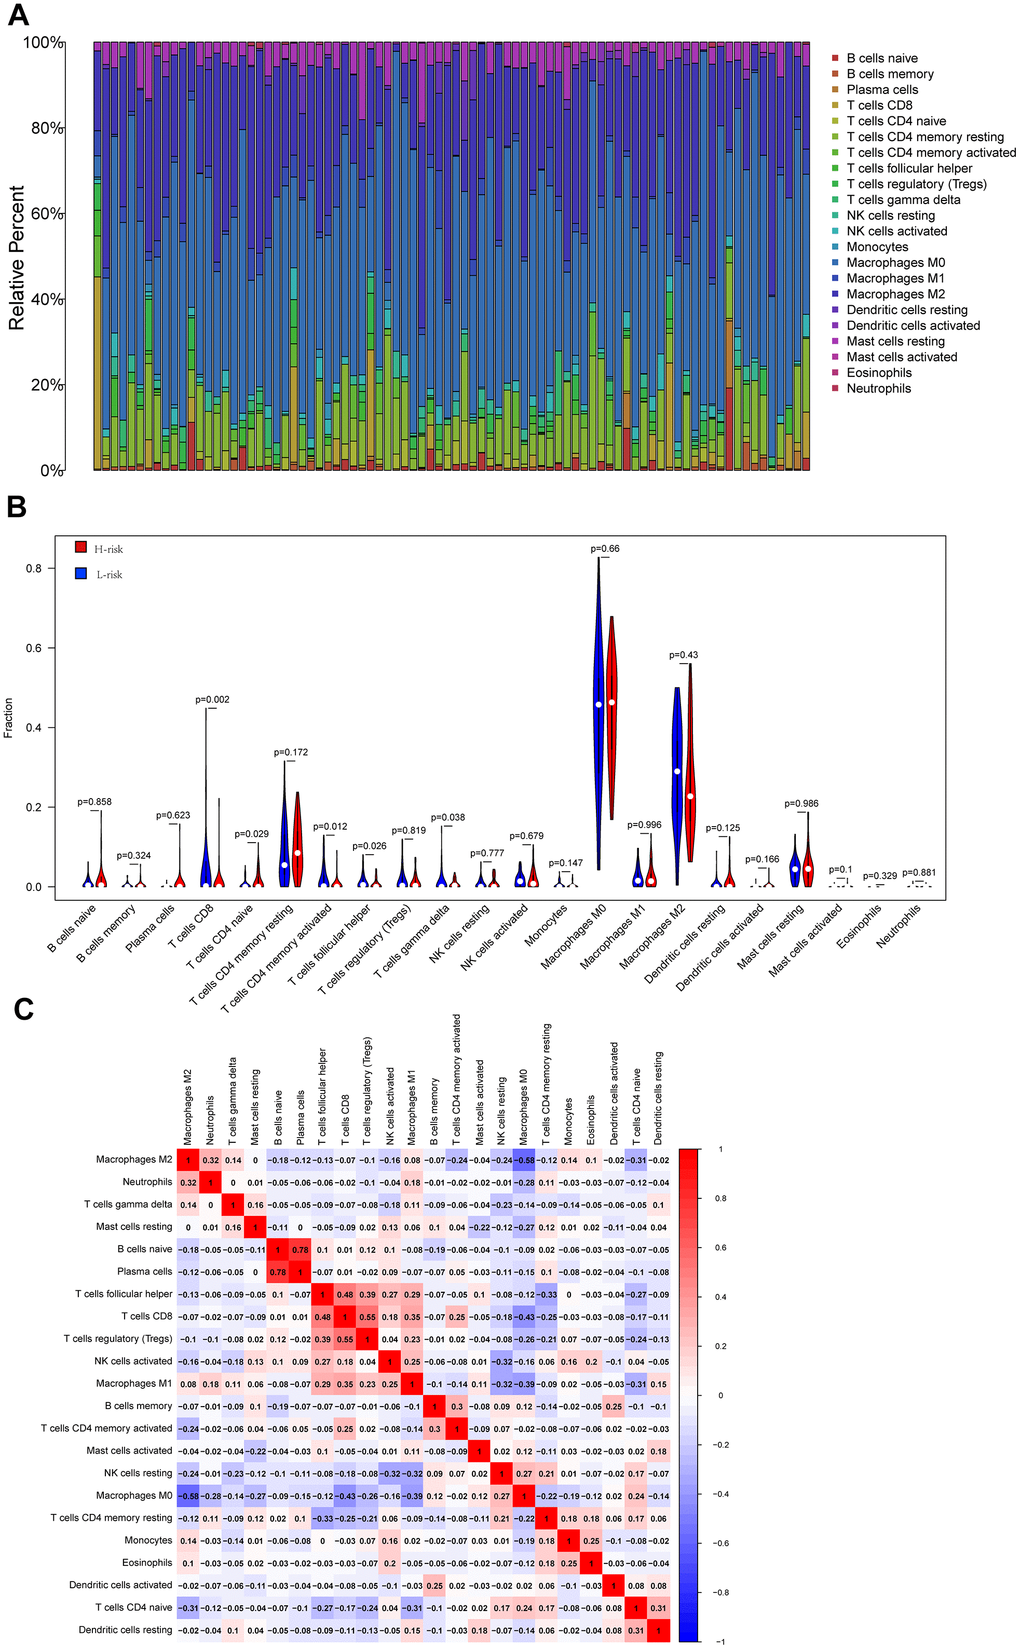
Figure 5.Cibersort analysis results. (A) The relative proportion of immune cells in 84 osteosarcoma patients; (B) The violin diagram shows the difference in the proportion of immune cell infiltration between the low-risk group and the high-risk group. (C) Correlation between immune cells.