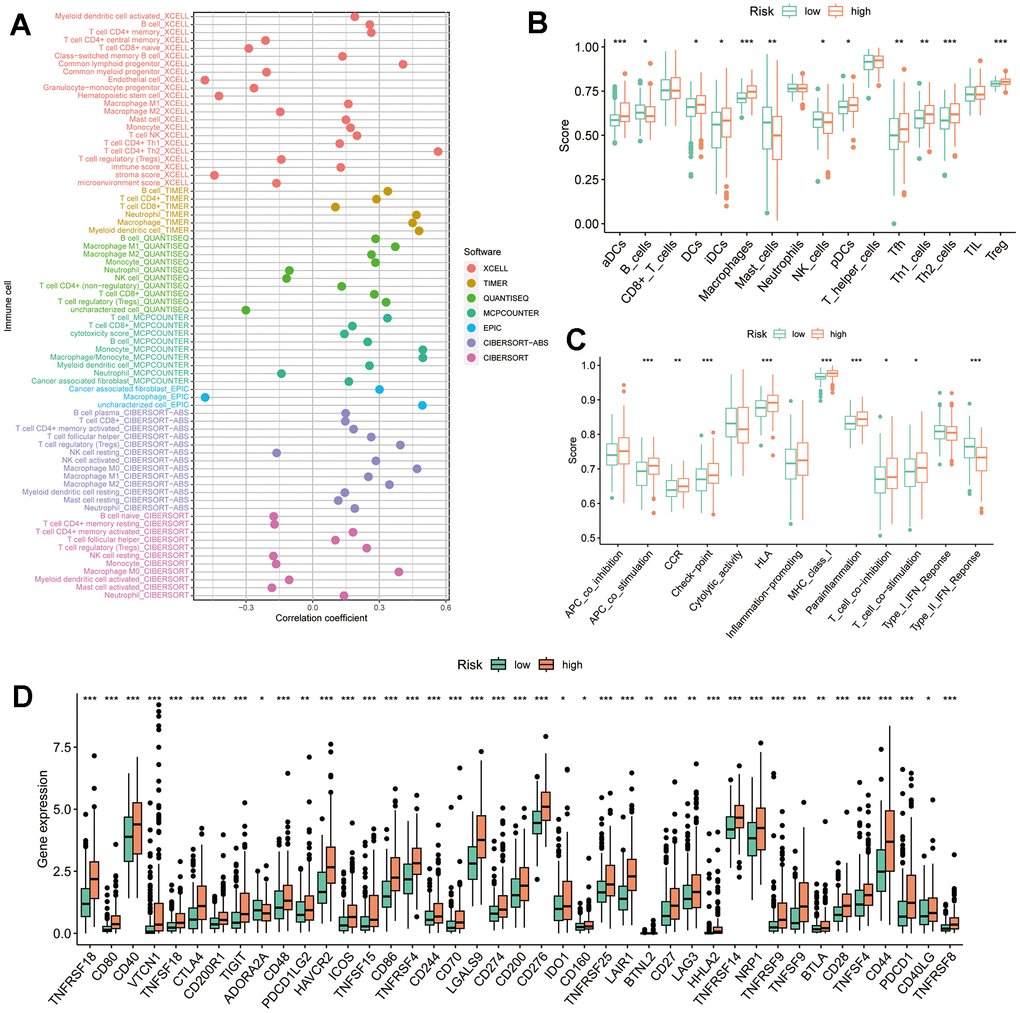
Figure 11.TRSSys-based TIME analysis. (A) Correlation bubble plot between the degree of immune cell infiltration and risk score. (B, C) Differences in immune cell scores and immune function scores across risk subgroups. (D) Differences in expression of immune checkpoints across risk subgroups.