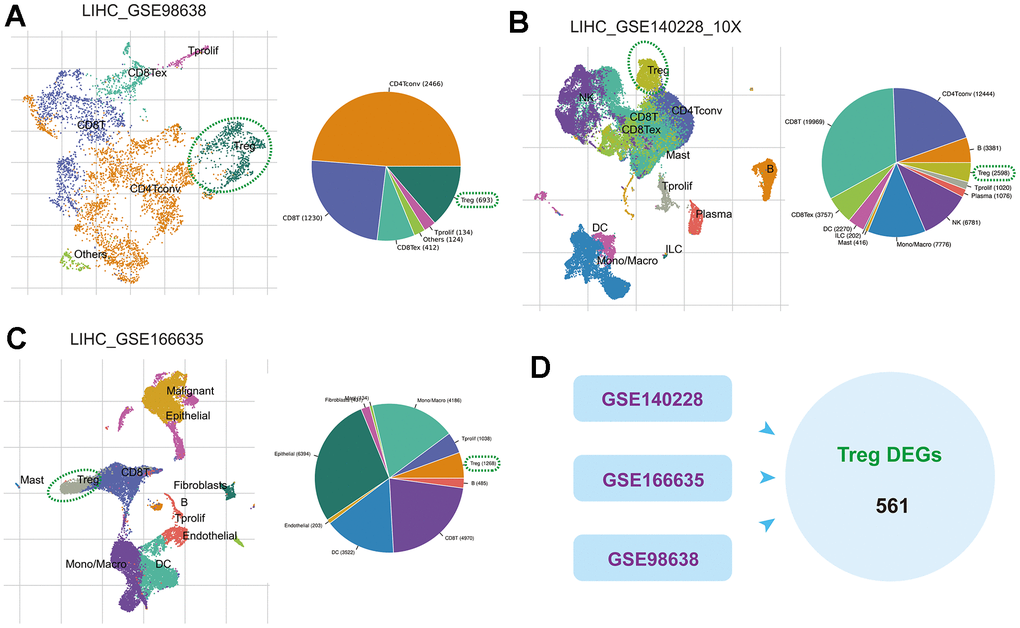
Figure 1.The scRNA-seq analysis identifies Tregs in HCC. (A–C) Annotation of cell clusters in the GSE98638, GSE140228 and GSE166635 cohorts. (D) DEGs between Tregs and other cell types in these three cohorts.
Figure 1 — Comprehensive assessment of regulatory T-cells-related scoring system for predicting the prognosis, immune microenvironment and therapeutic response in hepatocellular carcinoma | Aging