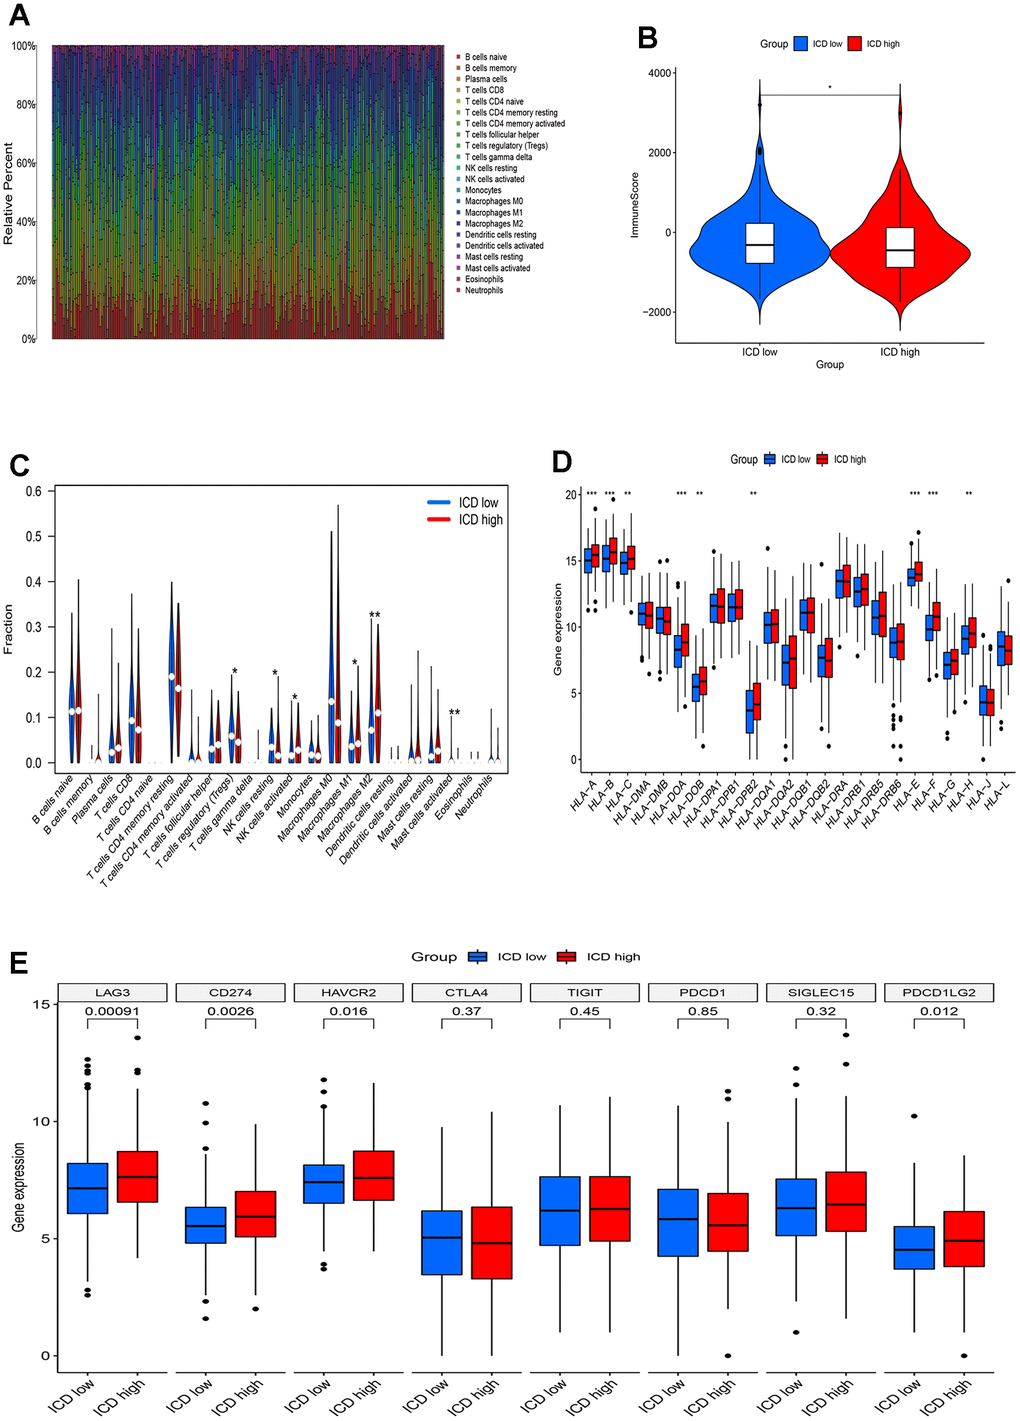
Figure 4.Immune landscape of ICD-high and ICD-low groups. (A) Relative proportion of immune infiltration in ICD-high and ICD-low groups; (B) Violin plots show the median, and quartile estimations for each immune score; (C) Violin plot visualizes significantly different immune cells between different groups; (D, E) Box plots present differential expression of HLA genes (D) and multiple immune checkpoints (E) between ICD-high and ICD-low groups. *p< 0.05, **p< 0.01, ***p< 0.001, and ****p< 0.0001.