Submit an Article
Navigate
Home
Editorial Board
Editorial Policies
Current Volume
Archive
Scientific Integrity
Publication Ethics Statements
Interviews with Outstanding Authors
Newsroom
Sponsored Conferences
Podcast
Contact
Special Collections
Submit an Article
Online ISSN: 1945-4589
Research Paper
|
Volume 16, Issue 6
|
pp. 5149–5162
A novel immune-related lncRNA signature predicts the prognosis and immune landscape in ccRCC
Back to article
Figure 6
(6 of 7)
−
100%
+
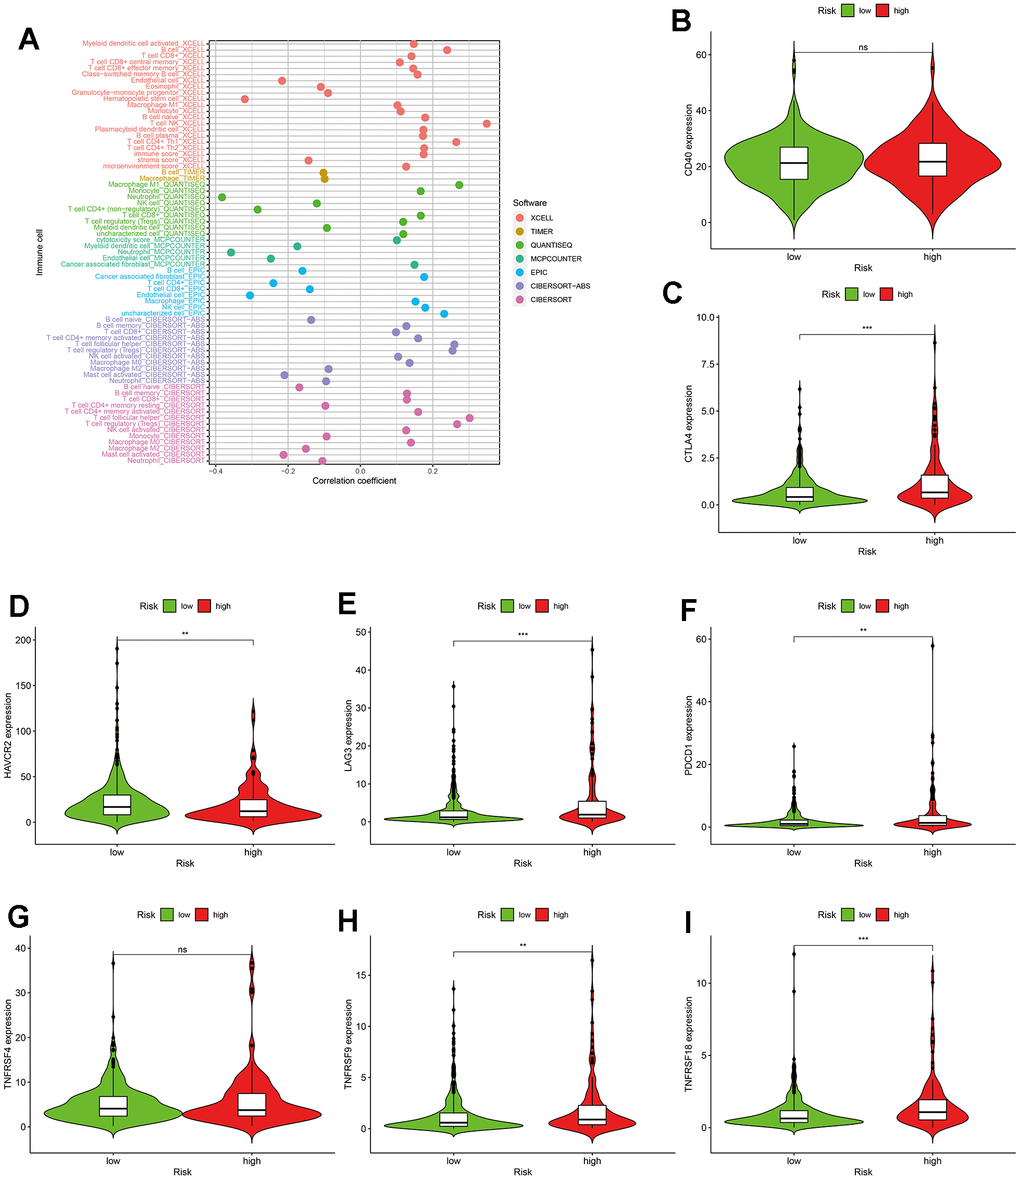
Figure 6.
The application of the risk assessment model in tumor-infiltrating cells and immunosuppressed molecules.
(
A
) The lollipop diagram. (
B
–
I
) The relationship between risk scores and immunosuppressed molecules.