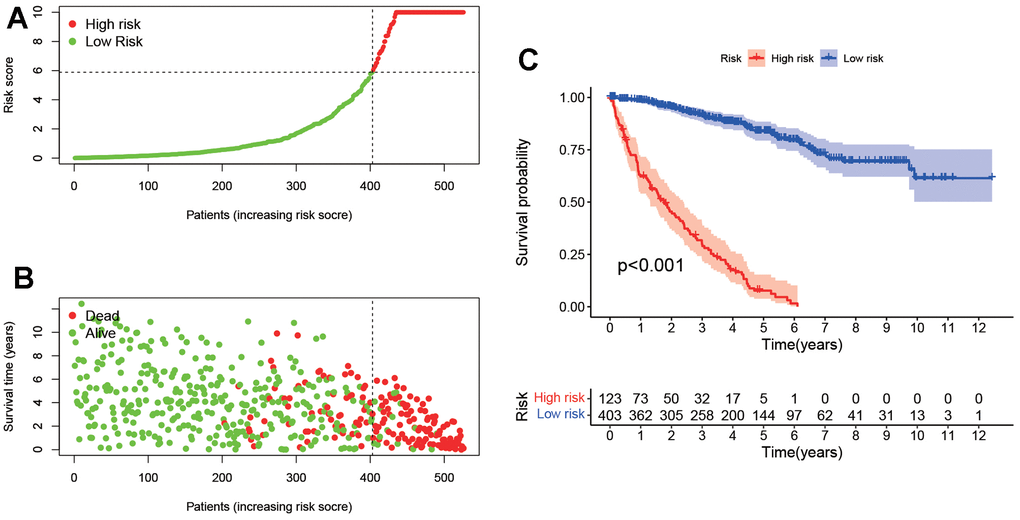
Figure 4.Survival analysis according to the risk assessment model. (A) The distribution of risk scores. (B) The relationship between risk scores and survival times. (C) Kaplan-Meier survival curves suggested that the patients in low-risk group have a better prognosis.