Submit an Article
Navigate
Home
Editorial Board
Editorial Policies
Current Volume
Archive
Scientific Integrity
Publication Ethics Statements
Interviews with Outstanding Authors
Newsroom
Sponsored Conferences
Podcast
Contact
Special Collections
Submit an Article
Online ISSN: 1945-4589
Research Paper
|
Volume 16, Issue 5
|
pp. 4778–4788
The low expression of miR-155 promotes the expression of SHP2 by inhibiting the activation of the ERK1/2 pathway and improves cell pyroptosis induced by I/R in mice
Back to article
Figure 3
(3 of 6)
−
100%
+
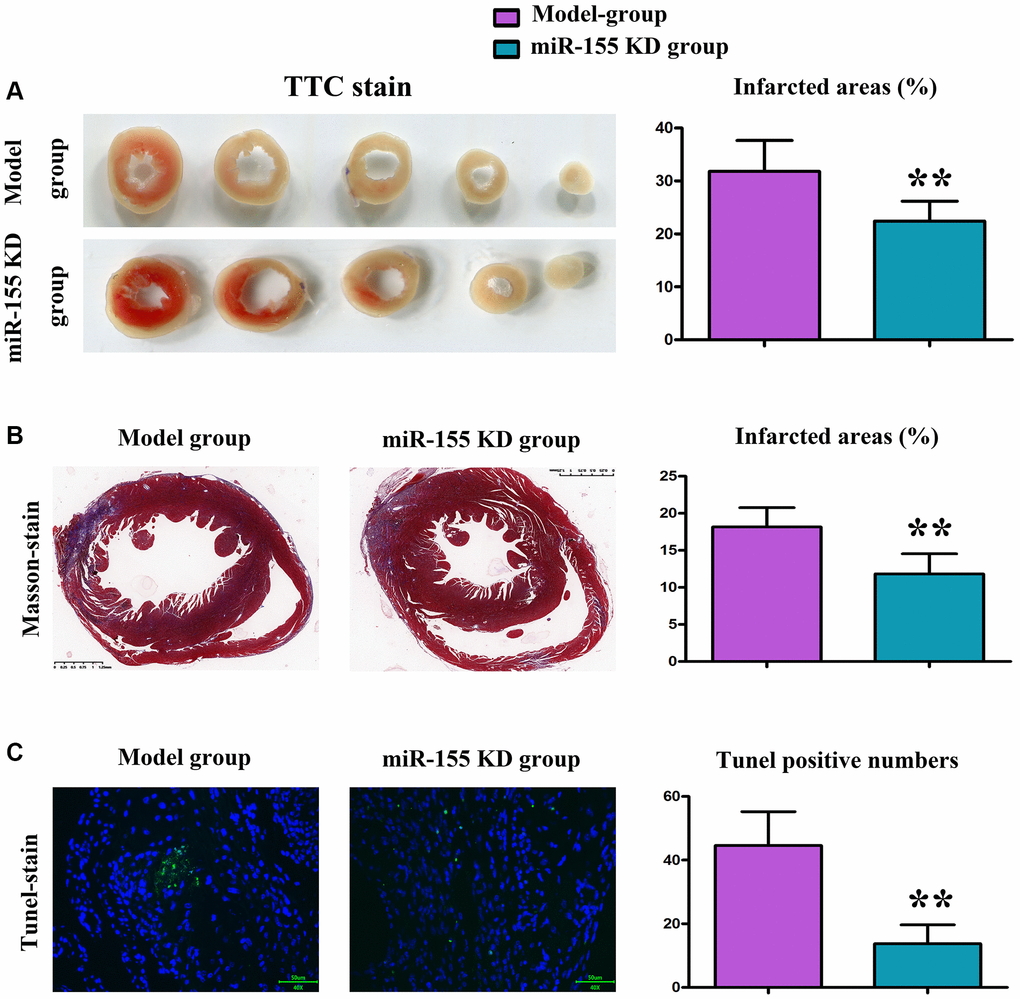
Figure 3.
Changes in myocardial infarction (MI) in mice.
(
A
) TTC staining of myocardial tissue and MI area. (
B
) Masson staining of myocardial tissue and MI area. (
C
) Results of TUNEL staining and number of positive apoptotic cells.