Submit an Article
Navigate
Home
Editorial Board
Editorial Policies
Current Volume
Archive
Scientific Integrity
Publication Ethics Statements
Interviews with Outstanding Authors
Newsroom
Sponsored Conferences
Podcast
Contact
Special Collections
Submit an Article
Online ISSN: 1945-4589
Research Paper
|
Volume 16, Issue 5
|
pp. 4778–4788
The low expression of miR-155 promotes the expression of SHP2 by inhibiting the activation of the ERK1/2 pathway and improves cell pyroptosis induced by I/R in mice
Back to article
Figure 1
(1 of 6)
−
100%
+
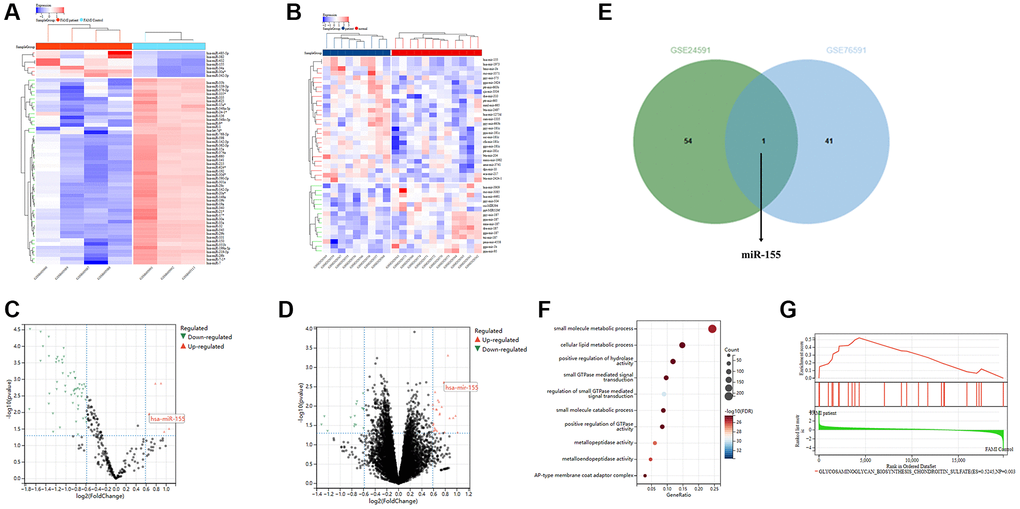
Figure 1.
Bioinformatics analysis results.
(
A
,
B
) Heatmaps of clustered differentially expressed genes (DEGs) in GSE24591 and GSE76591. (
C
,
D
) Volcano plots of DEGs in GSE24591 and GSE76591. (
E
) Venn diagram. (
F
) KEGG pathways. (
G
) GSEA.