Submit an Article
Navigate
Home
Editorial Board
Editorial Policies
Current Volume
Archive
Scientific Integrity
Publication Ethics Statements
Interviews with Outstanding Authors
Newsroom
Sponsored Conferences
Podcast
Contact
Special Collections
Submit an Article
Online ISSN: 1945-4589
Research Paper
|
Volume 16, Issue 6
|
pp. 5123–5148
The comprehensive landscape of prognosis, immunity, and function of the GLI family by pan-cancer and single-cell analysis
Back to article
Figure 6
(6 of 15)
−
100%
+
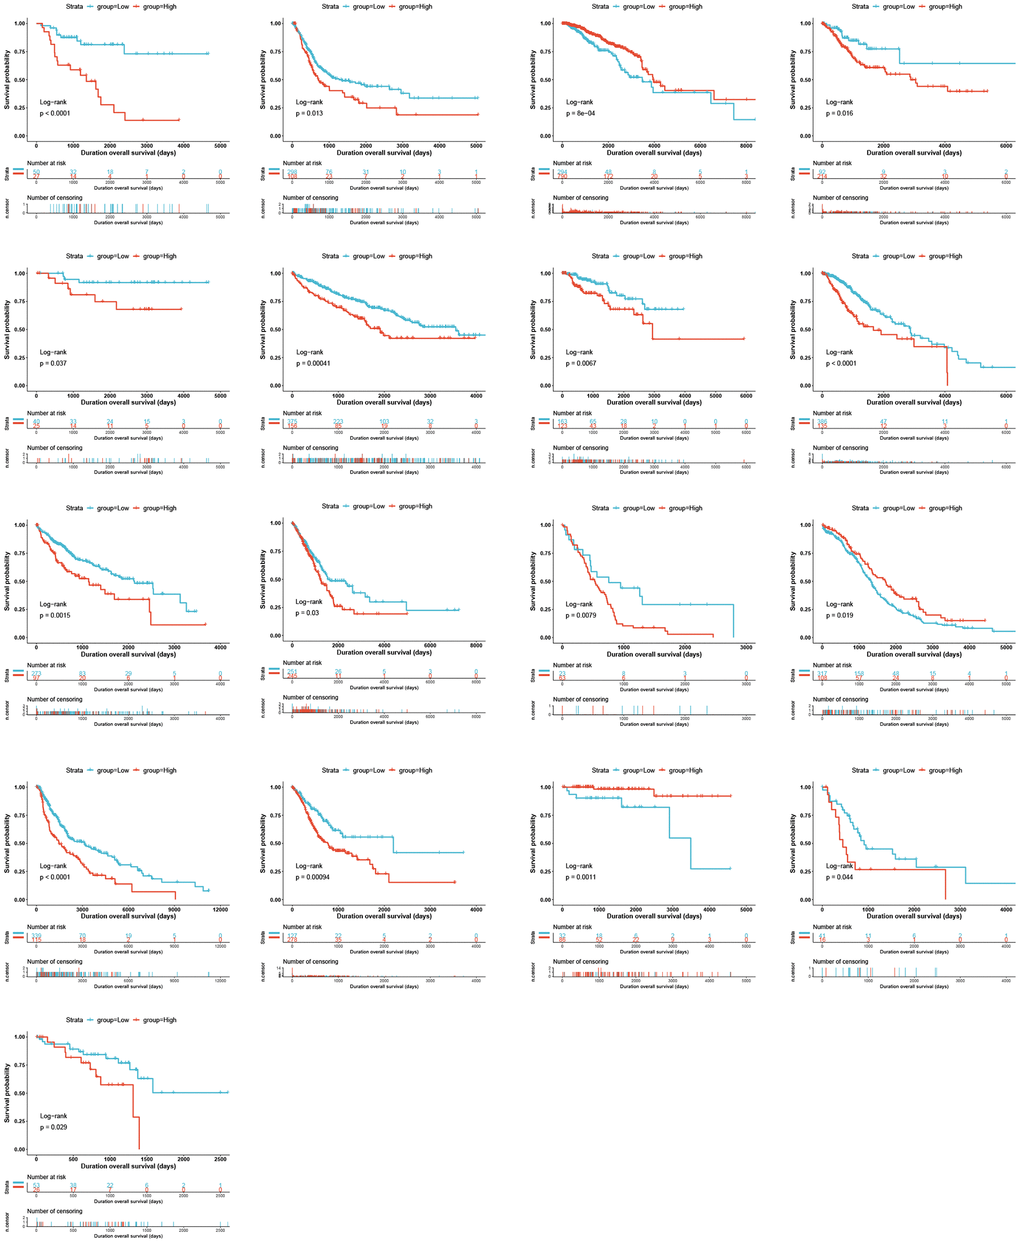
Figure 6.
Kaplan–Meier OS curves for patients stratified by different expression levels of GLI1 in seventeen cancer types.