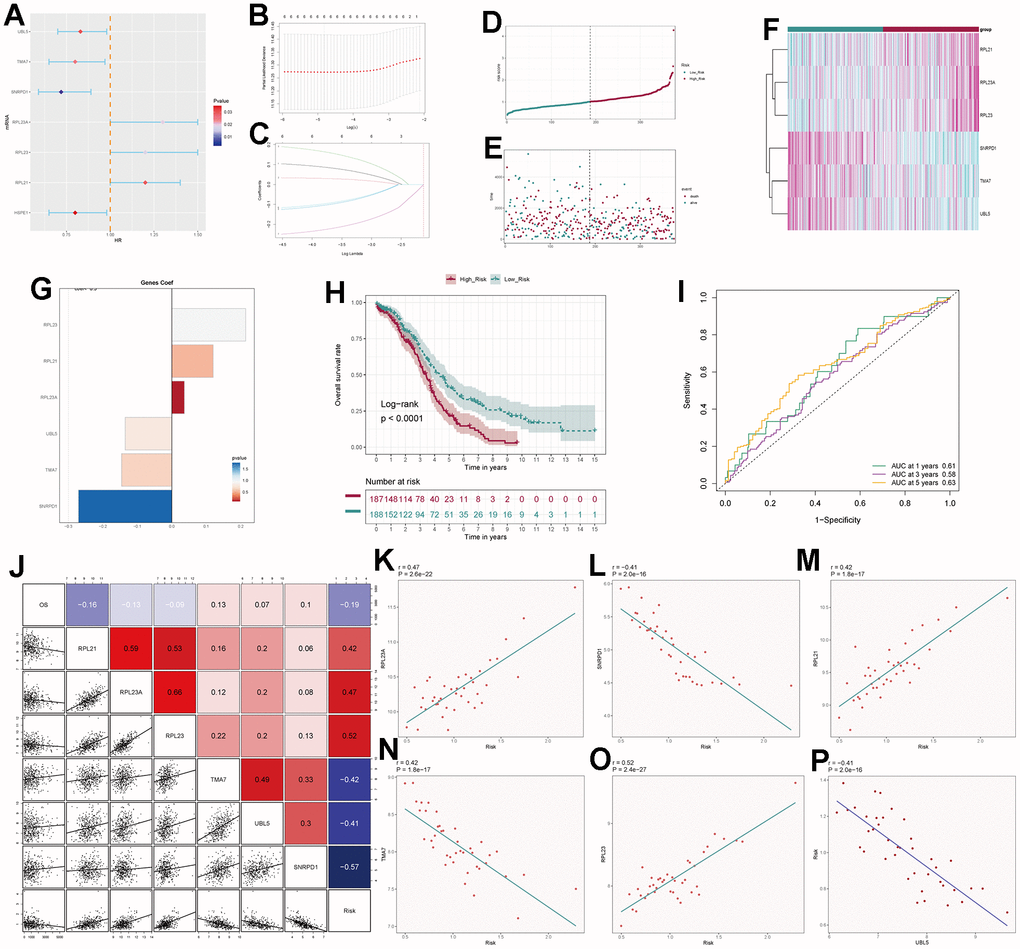
Figure 9.Independent prognostic analysis. (A) Seven differentially expressed genes associated with prognosis. (B) Distribution of LASSO analysis coefficient spectrum for six prognostic genes. (C) Parameter selection in the optimal cross-validation LASSO regression. (D) Patients categorized into high- and low-risk groups based on their risk scores. (E) Distribution of patients in the high- and low-risk groups. (F) Heatmap showing the distribution of prognosis-related genes. (G) Cofe values of prognosis-related genes. (H) Kaplan-Meier survival analysis curves for high- and low-risk groups. (I) Time-dependent ROC curves with area under the curve (AUC) values of 0.61, 0.58, and 0.63 for 1-year, 3-year, and 5-year intervals. (J–P) Correlation analysis of genes with risk scores and overall survival (OS).