Submit an Article
Navigate
Home
Editorial Board
Editorial Policies
Current Volume
Archive
Scientific Integrity
Publication Ethics Statements
Interviews with Outstanding Authors
Newsroom
Sponsored Conferences
Podcast
Contact
Special Collections
Submit an Article
Online ISSN: 1945-4589
Research Paper
|
Volume 16, Issue 5
|
pp. 4736–4758
Investigating the mechanisms of drug resistance and prognosis in ovarian cancer using single-cell RNA sequencing and bulk RNA sequencing
Back to article
Figure 8
(8 of 12)
−
100%
+
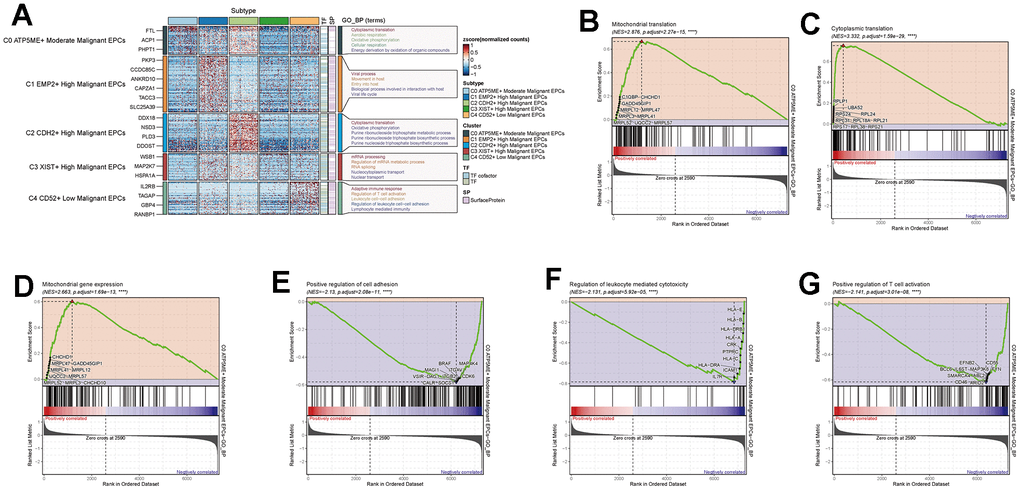
Figure 8.
Enrichment analysis of subgroup cells.
(
A
) GO enrichment analysis of subgroup cells. (
B
–
G
) GSEA enrichment analysis of C0 subgroup cells.