Submit an Article
Navigate
Home
Editorial Board
Editorial Policies
Current Volume
Archive
Scientific Integrity
Publication Ethics Statements
Interviews with Outstanding Authors
Newsroom
Sponsored Conferences
Podcast
Contact
Special Collections
Submit an Article
Online ISSN: 1945-4589
Research Paper
|
Volume 16, Issue 5
|
pp. 4563–4578
Machine learning-based endoplasmic reticulum-related diagnostic biomarker and immune microenvironment landscape for osteoarthritis
Back to article
Figure 8
(8 of 8)
−
100%
+
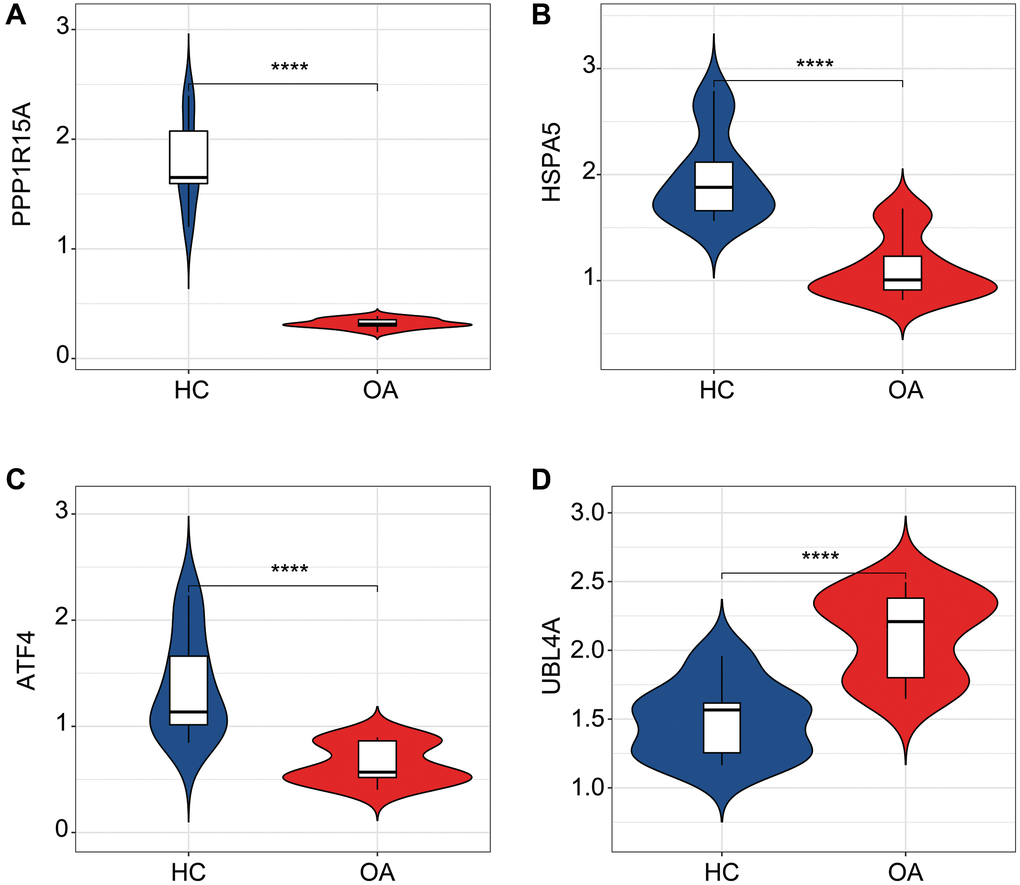
Figure 8.
qRT-PCR analysis of the four ERRGs related biomarkers in OA and HC groups.
The expression profiler of (
A
) ATF4, (
B
) HSPA5, (
C
) PPP1R15A and (
D
) UBL4A in HC and OA groups.
*
p
< 0.05,
**
p
< 0.01,
***
p
< 0.001,
****
p
< 0.0001.