Submit an Article
Navigate
Home
Editorial Board
Editorial Policies
Current Volume
Archive
Scientific Integrity
Publication Ethics Statements
Interviews with Outstanding Authors
Newsroom
Sponsored Conferences
Podcast
Contact
Special Collections
Submit an Article
Online ISSN: 1945-4589
Research Paper
|
Volume 16, Issue 6
|
pp. 5077–5090
FOXQ1 inhibits the progression of osteoarthritis by regulating pyroptosis
Back to article
Figure 4
(4 of 7)
−
100%
+
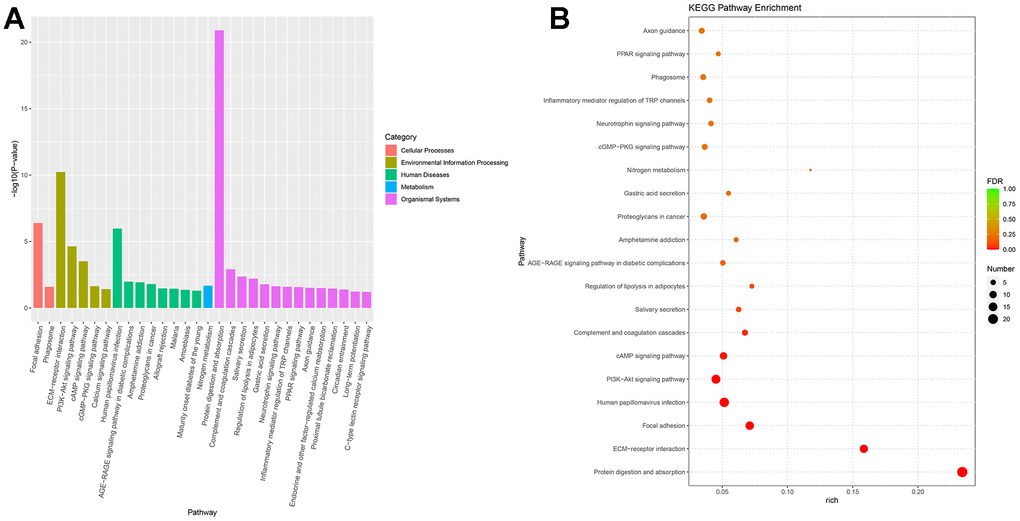
Figure 4.
KEGG enrichment of differential expressed genes.
(
A
) Bar plot of KEGG enrichment. (
B
) Bubble plot of KEGG enrichment.