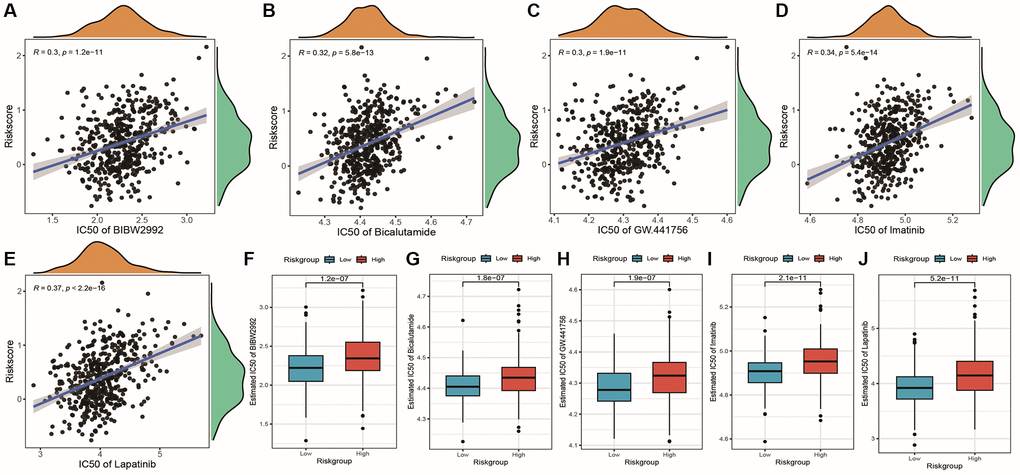
Figure 13.Correlation between risk score and chemotherapy drug resistance. (A–E) Scatter plots showing the correlation between risk score and drug IC50 values, with R representing the correlation coefficient and p-value indicating the significance of the correlation; (F–J) Box plots showing differences in drug IC50 values between high and low-risk groups.