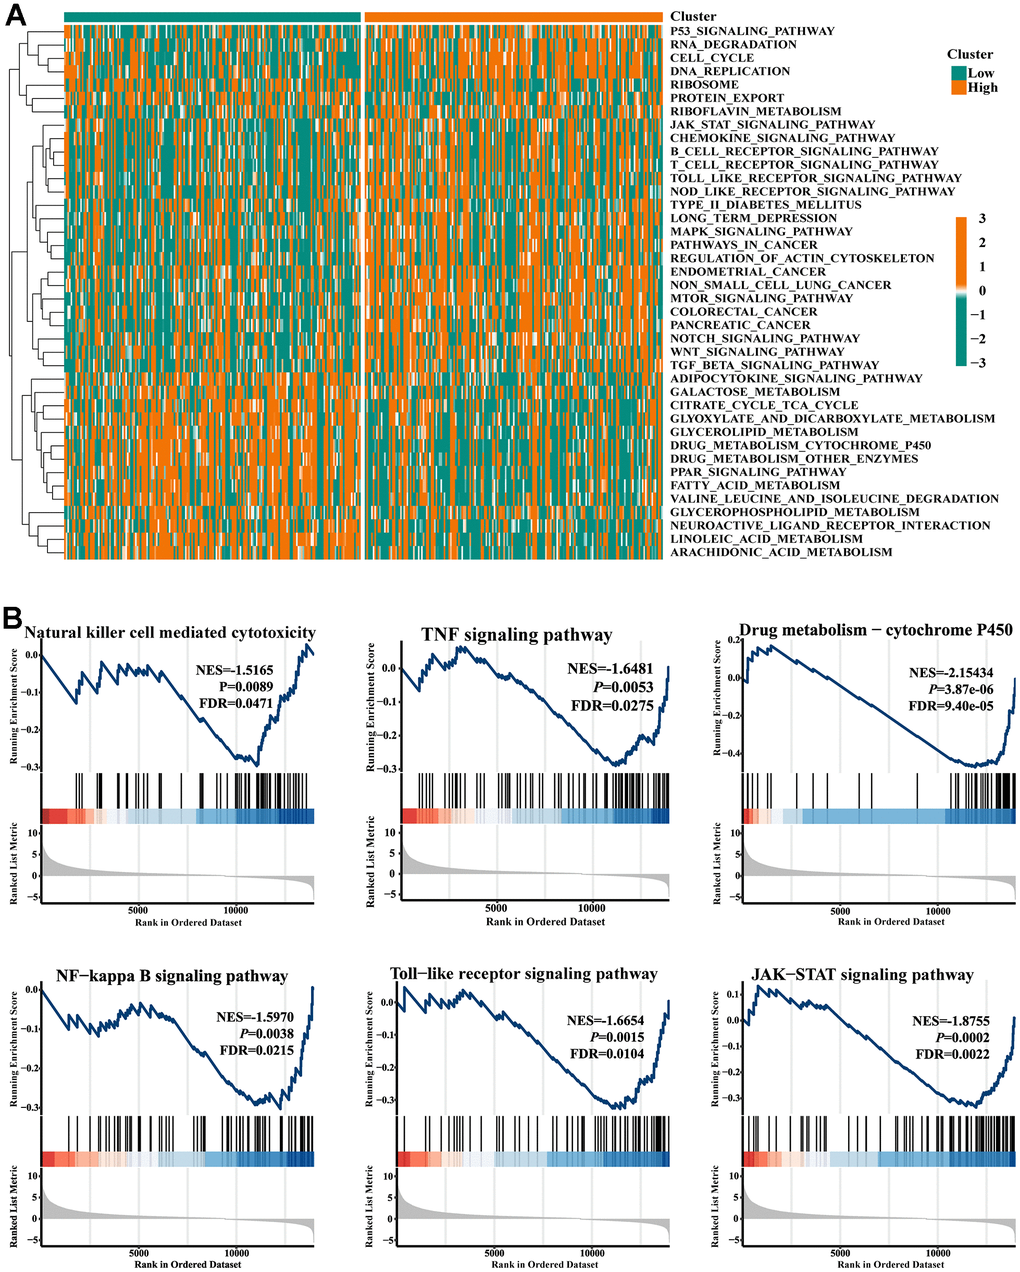
Figure 3.Gene set enrichment analysis. (A) Heat map showed the KEGG pathways differences between low- and high-FIGN expression patients. (B) Pathways enriched in the Nature killer cell cytotoxicity, TNF signaling, Drug metabolism-P450, NF-kappa B signaling, Toll-like receptor signaling, and JAK-STAT signaling.