Submit an Article
Navigate
Home
Editorial Board
Editorial Policies
Current Volume
Archive
Scientific Integrity
Publication Ethics Statements
Interviews with Outstanding Authors
Newsroom
Sponsored Conferences
Podcast
Contact
Special Collections
Submit an Article
Online ISSN: 1945-4589
Research Paper
|
Volume 16, Issue 5
|
pp. 4327–4347
4-Hydroxyphenylpyruvate Dioxygenase-Like predicts the prognosis and the immunotherapy response of cancers: a pan-cancer analysis
Back to article
Figure 3
(3 of 8)
−
100%
+
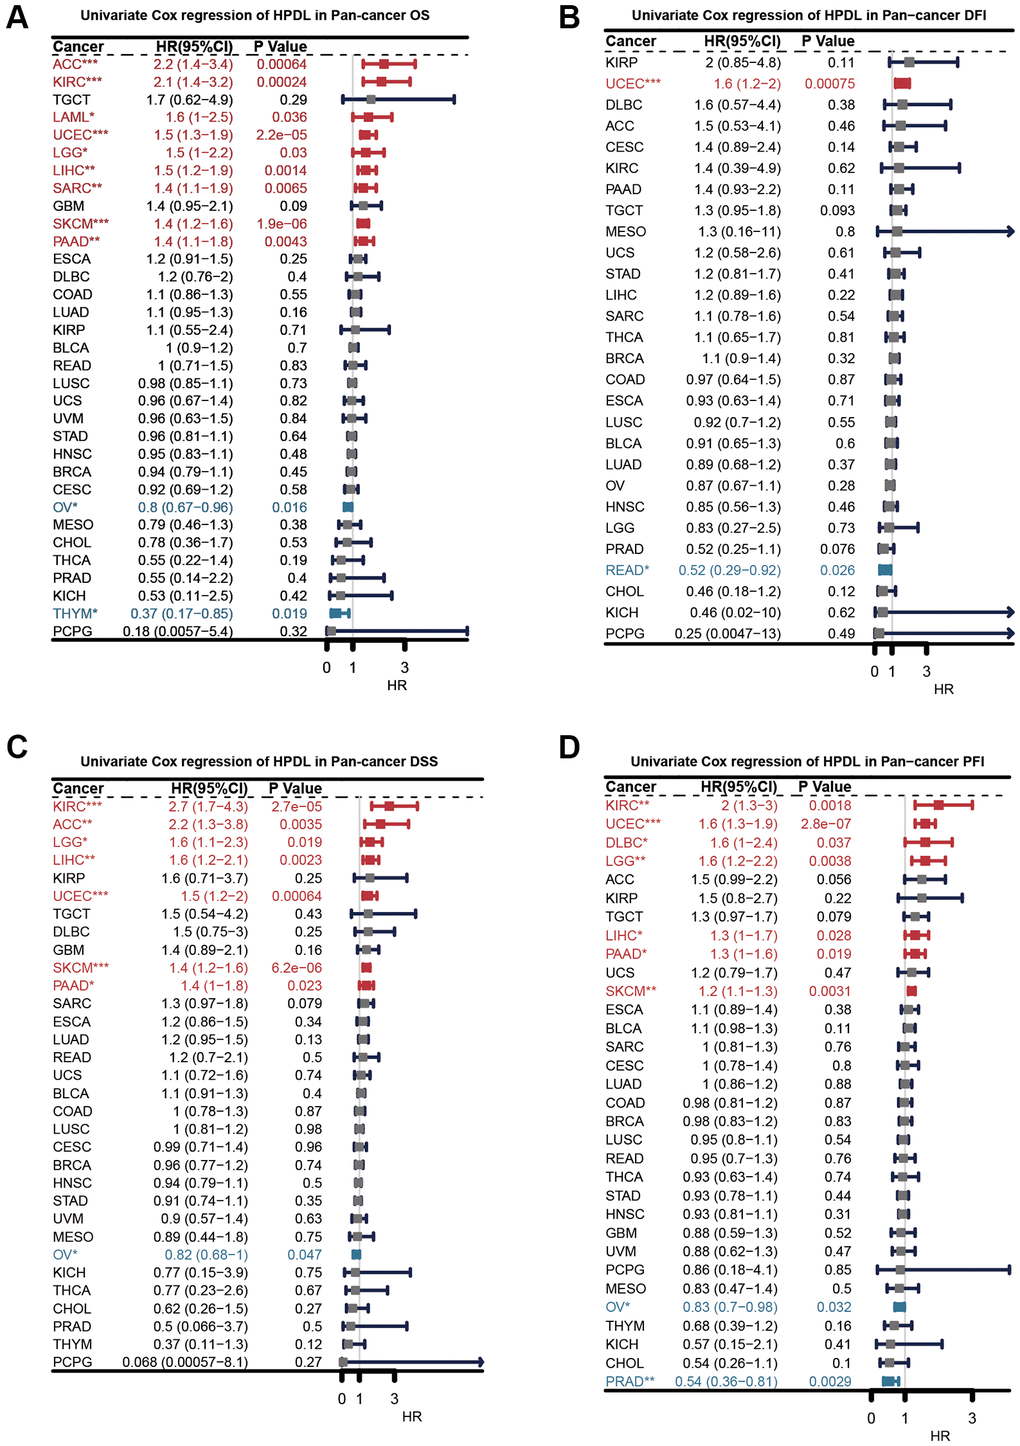
Figure 3.
Univariate Cox regression analysis of HPDL.
The results were shown with a forest map for (
A
) OS; (
B
) DFI; (
C
) DSS; (
D
) PFI.