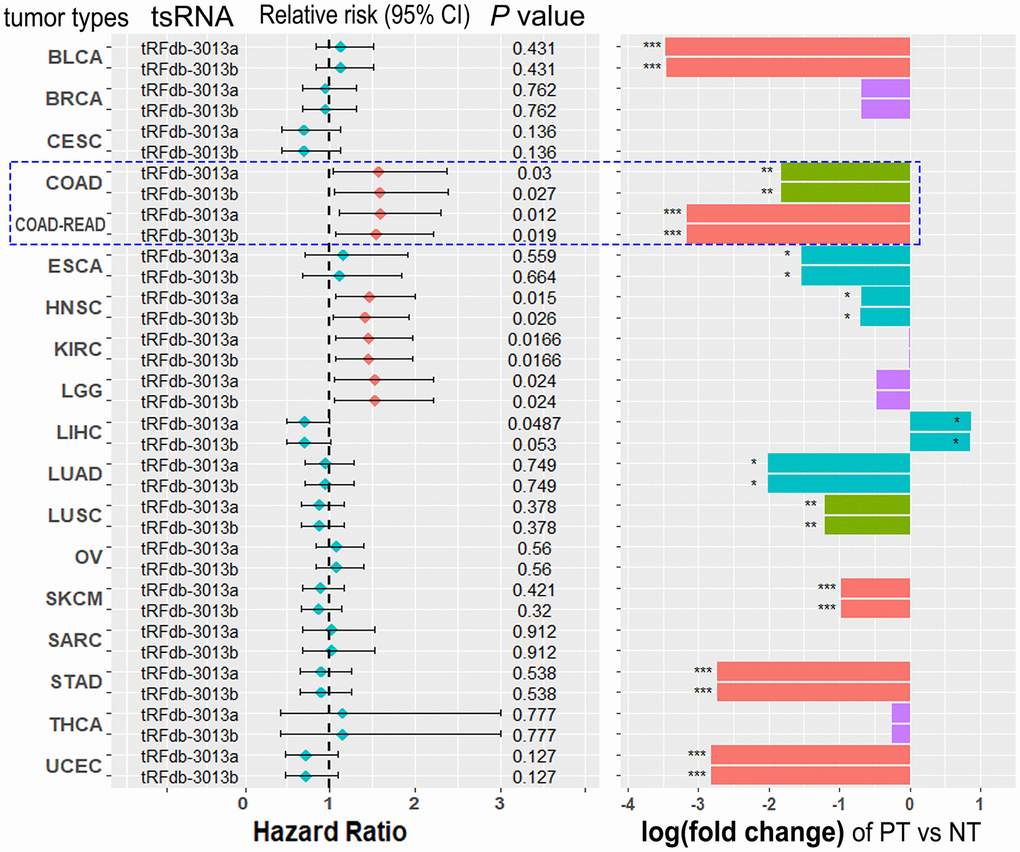
Figure 5.The clinical significances of tRFdb-3013a and tRFdb-3013b within multiple different types of tumors. (Left) The forest plots of Cox regression analysis with hazard ratio test based on tRFdb-3013a and tRFdb-3013b expressions within many types of tumors on TCGA dataset. (Right) The bar graph of differential expression analysis with a log2 fold-change test of tRFdb-3013a and tRFdb-3013b between primary tumor (TP) samples and non-tumor (NT) controls in multiple types of tumors.