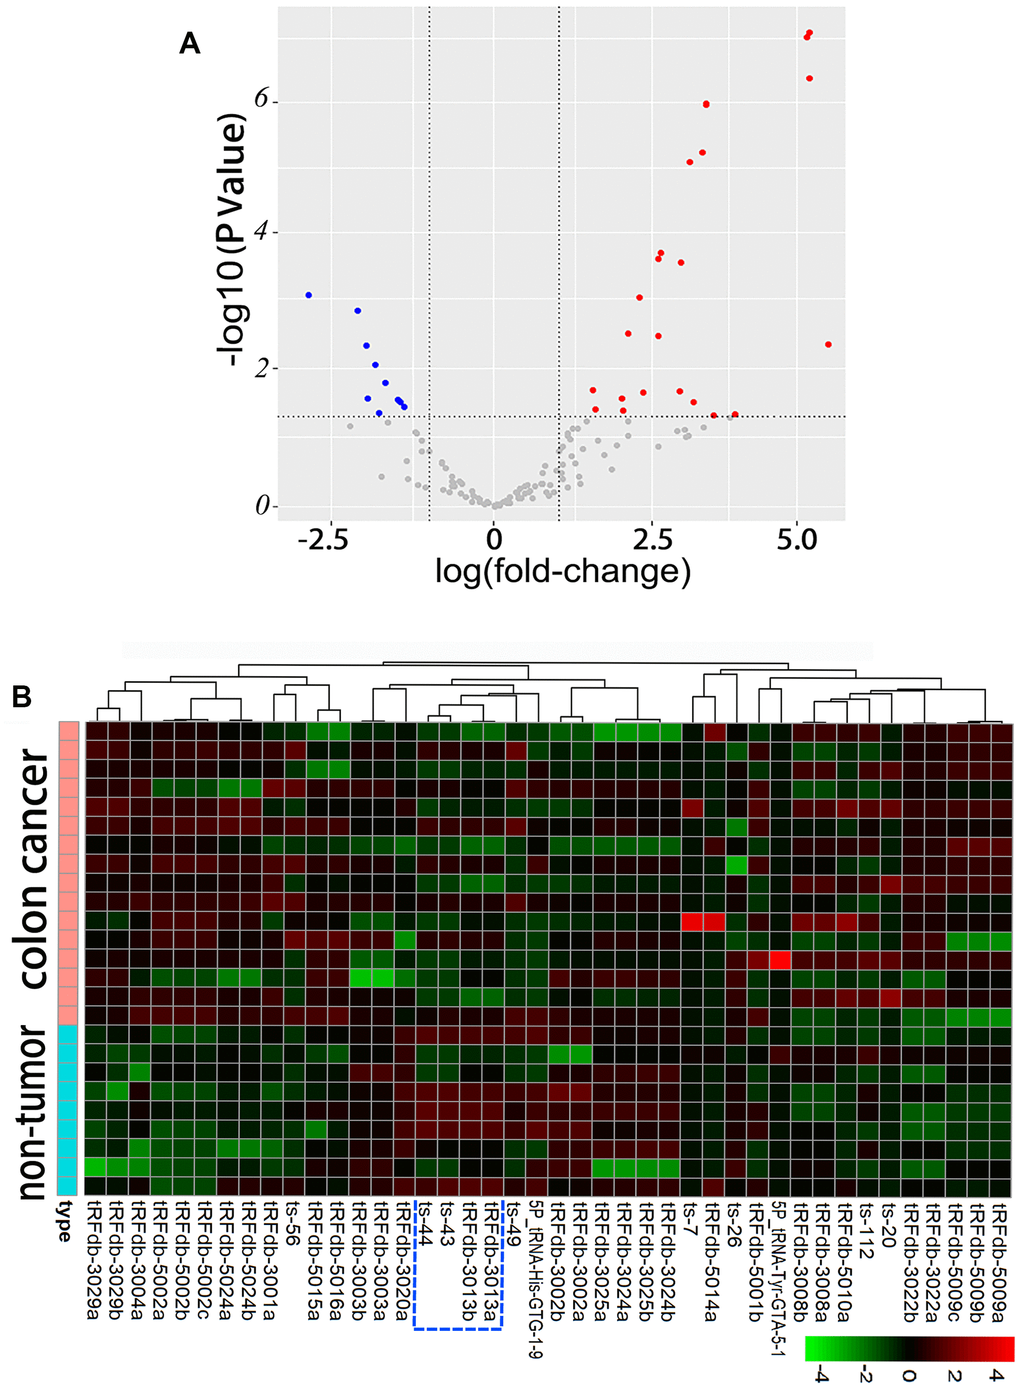
Figure 1.Differential expression analysis between paired colon adenocarcinomas (n=16) and non-tumor controls (n=9) of TCGA-COAD dataset. (A) Volcano plots of the differentially expressed tsRNAs, including 15 up-regulated and 27 down-regulated tsRNAs. (B) Hierarchical clustering and heatmap of differentially expressed tsRNAs, the up-regulated tsRNAs are clustered in red-shaded areas, and the green-shaded areas indicate down-regulation.