Submit an Article
Navigate
Home
Editorial Board
Editorial Policies
Current Volume
Archive
Scientific Integrity
Publication Ethics Statements
Interviews with Outstanding Authors
Newsroom
Sponsored Conferences
Podcast
Contact
Special Collections
Submit an Article
Online ISSN: 1945-4589
Research Paper
|
Volume 16, Issue 5
|
pp. 4282–4298
GABA in the anterior cingulate cortex mediates the association of white matter hyperintensities with executive function: a magnetic resonance spectroscopy study
Back to article
Figure 3
(3 of 6)
−
100%
+
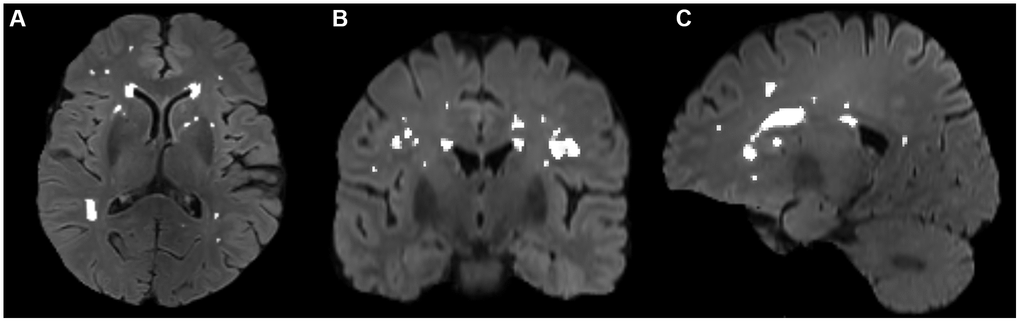
Figure 3.
Segmentation of WMH volumes in the transverse (
A
), coronal (
B
), and sagittal (
C
) positions on FLAIR images. The white color represents the automatically segmented WMH range. WMH, white matter hyperintensities.