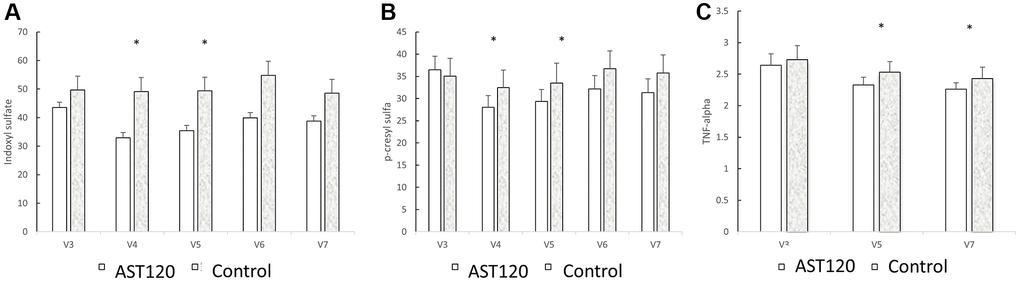
Figure 4.The comparison of indoxyl sulfate (A), p-cresol sulfate (B), and TNF-α (C) levels between the AST-120 group and the control group from the 3rd to the 7th visit. *p < 0.05, when comparing 3rd visit for AST-120 group.
Figure 4 — AST-120 improved uremic pruritus by lowering indoxyl sulfate and inflammatory cytokines in hemodialysis patients | Aging