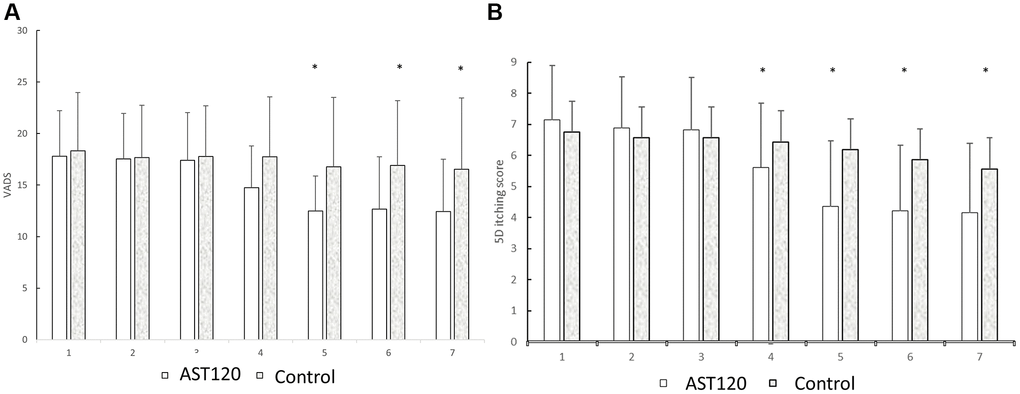
Figure 3.The comparison of the VADS (A) and 5D itch scores (B) between the AST-120 group and control group from the 1st to 7th visit. *p < 0.05, AST-120 vs. control group at each visit.
Figure 3 — AST-120 improved uremic pruritus by lowering indoxyl sulfate and inflammatory cytokines in hemodialysis patients | Aging