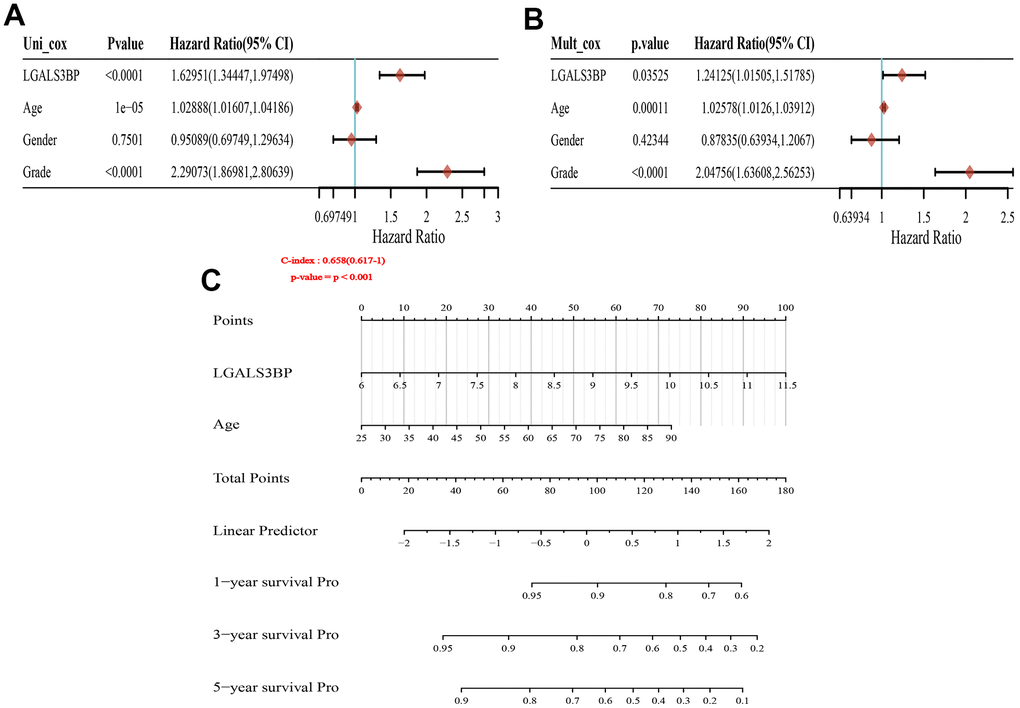
Figure 4.Forest plot and nomogram construction. (A) Forest plot of the association between risk factors and overall survival (OS) in TCGA-KIRC patients. (B) Prediction model of nomogram construction. (C) Constructing the clinicopathological characteristics model of the Norman diagram. p < 0.001.