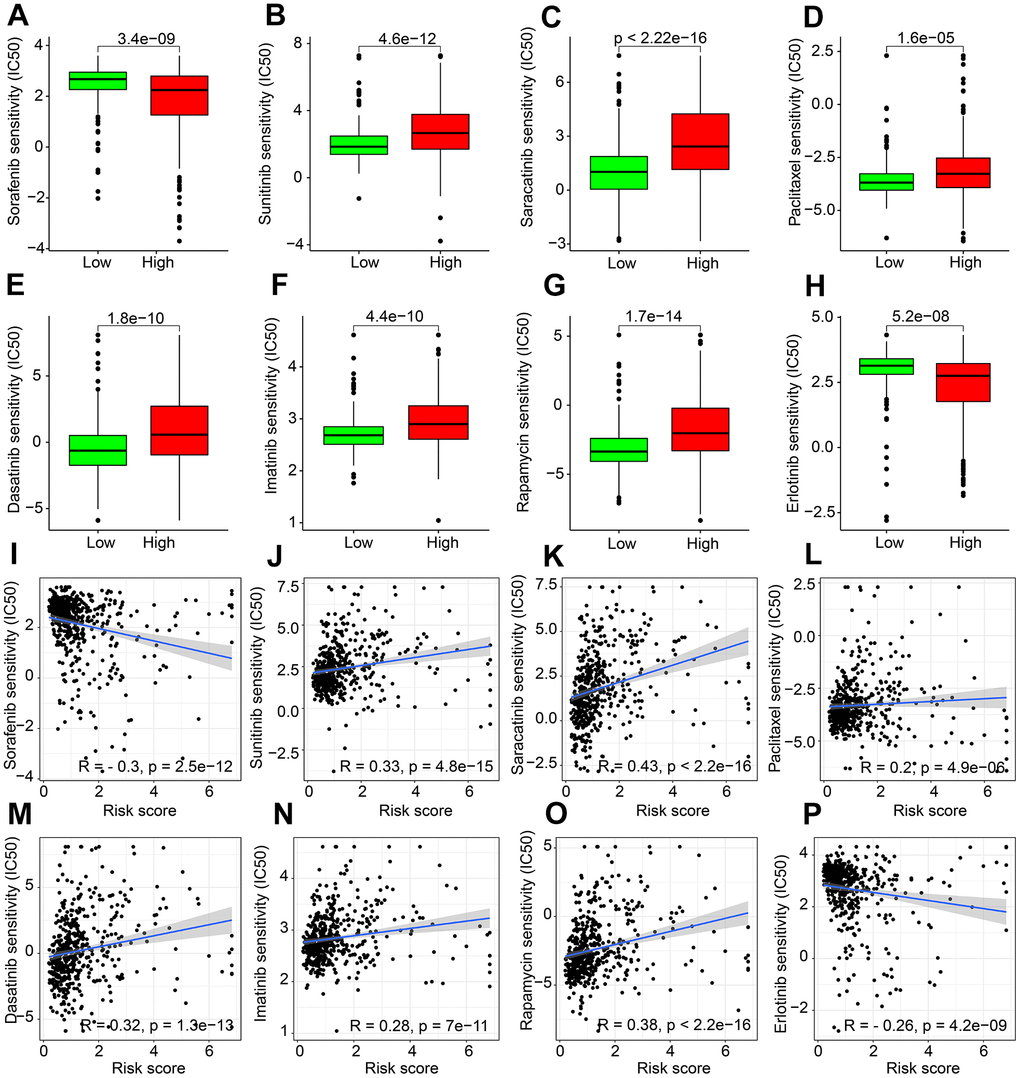
Figure 9.Drug sensitivity exploration. The distribution of IC50 in (A) Sorafenib. (B) Sunitinib. (C) Saracatinib. (D) Paclitaxel. (E) Dasatinib. (F) Imatinib. (G) Rapamycin. (H) Erlotinib. (I–P) Correlation analysis of ARLs prognostic signature and drug sensitivity (IC50).