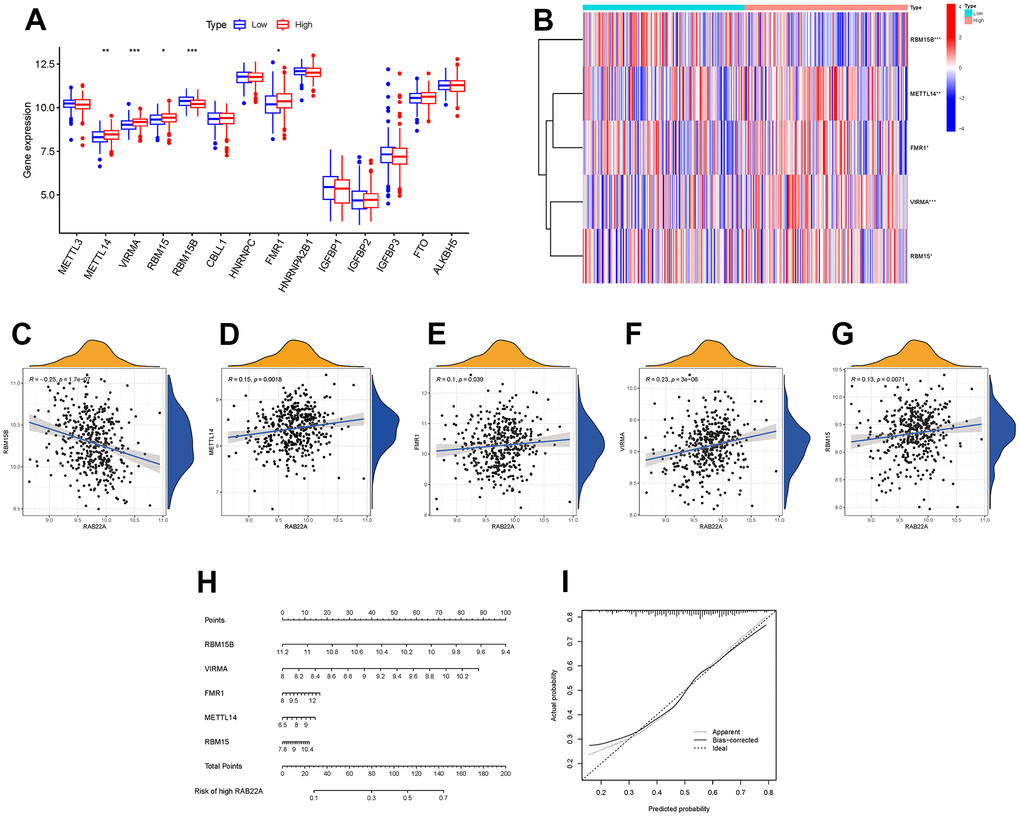
Figure 8.Relationship between RAB22A and m6A methylation. (A, B) Expression level of m6A methylation-related genes in different RAB22A groups. (C–G) Correlation and scatterplots between RAB22A and m6A methylation-related genes. (H, I) Nomogram and calibration curve of the risk of expressing RAB22A.