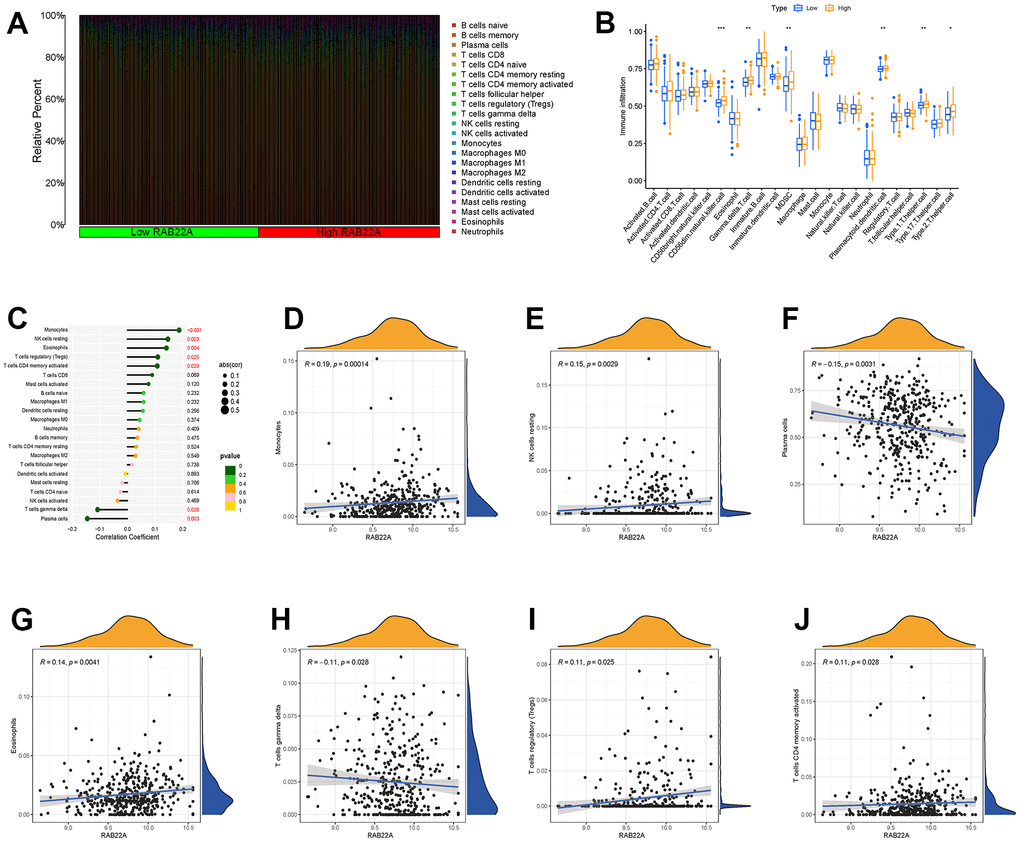
Figure 6.Relationship between RAB22A and immune cell infiltration. (A, B) Infiltration level of immune cells in high and low RAB22A groups. (C) Correlation between RAB22A and infiltration level of immune cells. (D–J) Scatterplots of RAB22A and immune cell infiltration.