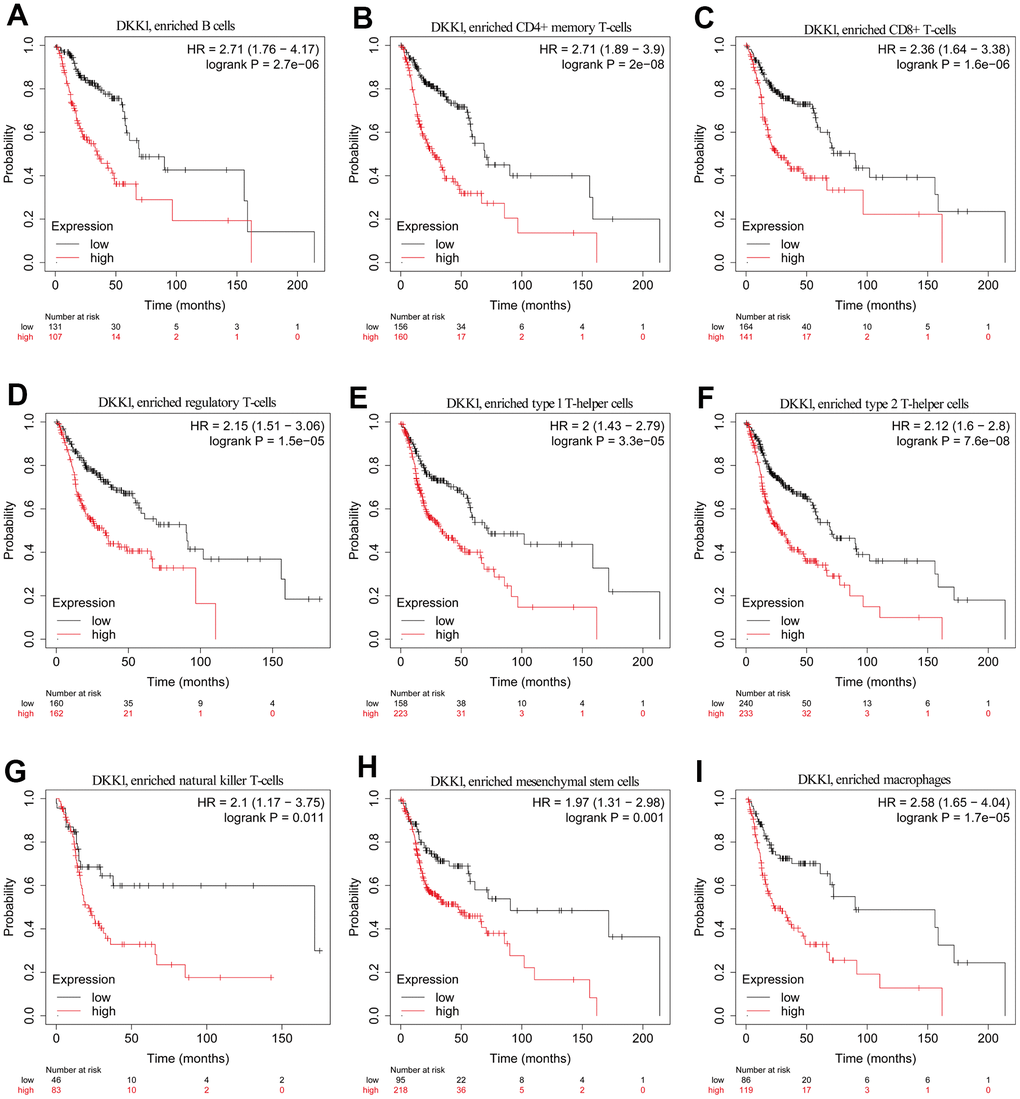
Figure 6.Comparison of KM survival curves of patients with low and high DKK1 expression in HNSCC, based on their immune subtypes. (A–I) Patients with HNSCC and high DKK1 levels in B cells, CD4+ memory T cells, CD8+ T cells, Treg cells, Th1 cells, Th2 cells, NK T cells, mesenchymal stem cells, and macrophages had a worse OS.