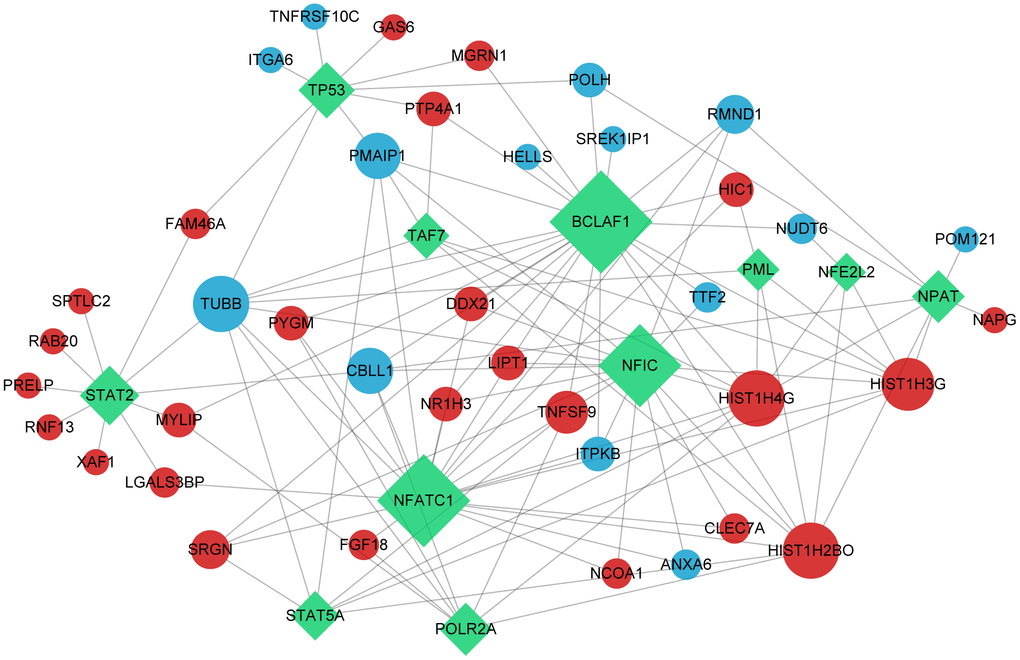
Figure 4.Transcription factors network. The green rectangle in the graph represents transcription factors; red and blue dots indicate up-regulated and down-regulated significant differential gene, respectively.
Figure 4 — PMAIP1, a novel diagnostic and potential therapeutic biomarker in osteoporosis | Aging