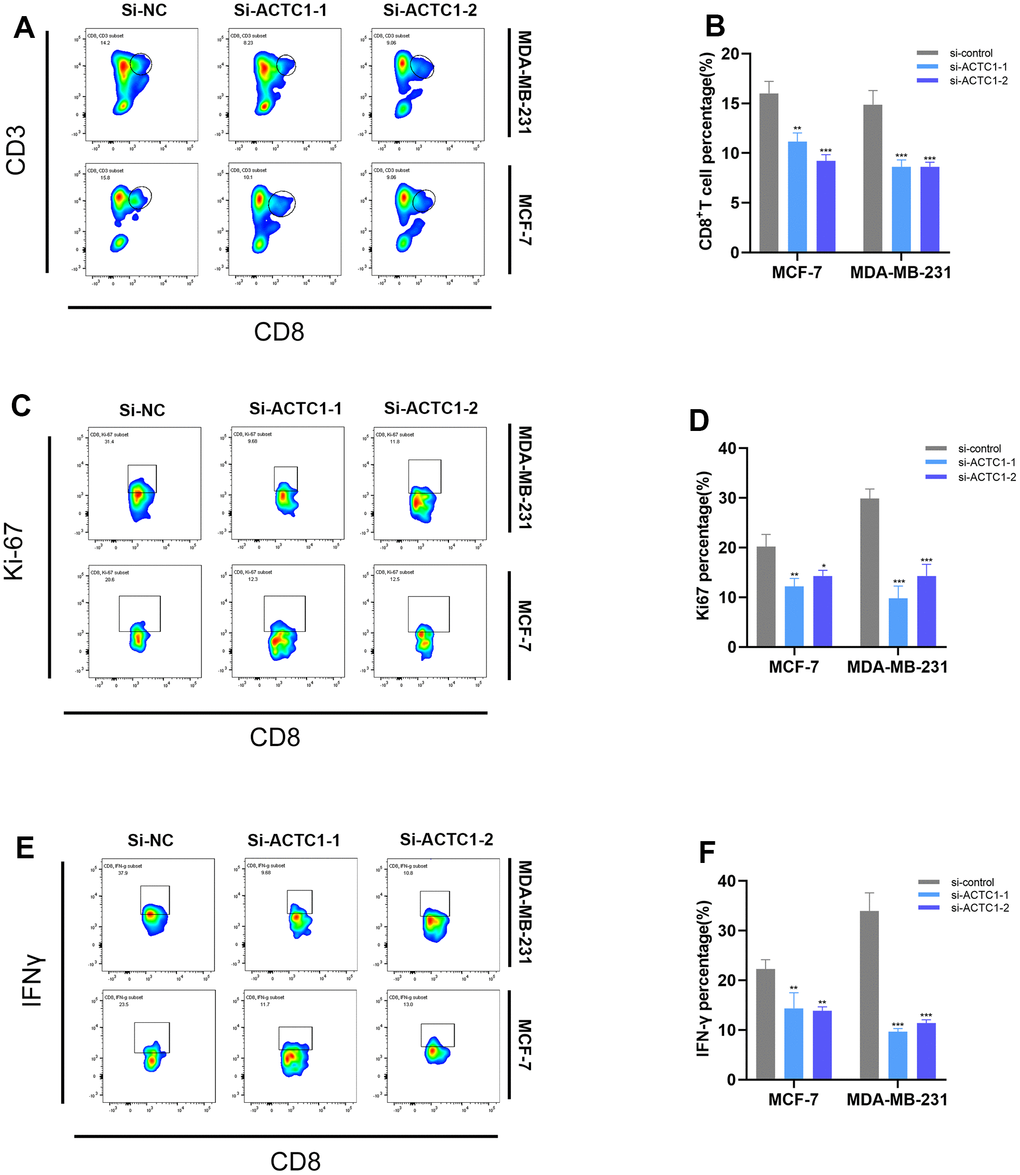
Figure 10.Flow cytometry. Representative plots (A) and a representative histogram (B) of the percentages of CD8+ T cells. Representative plots (C) and a representative histogram (D) of the percentages of Ki67. Representative plots (E) and a representative histogram (F) of the percentages of IFN-γ.