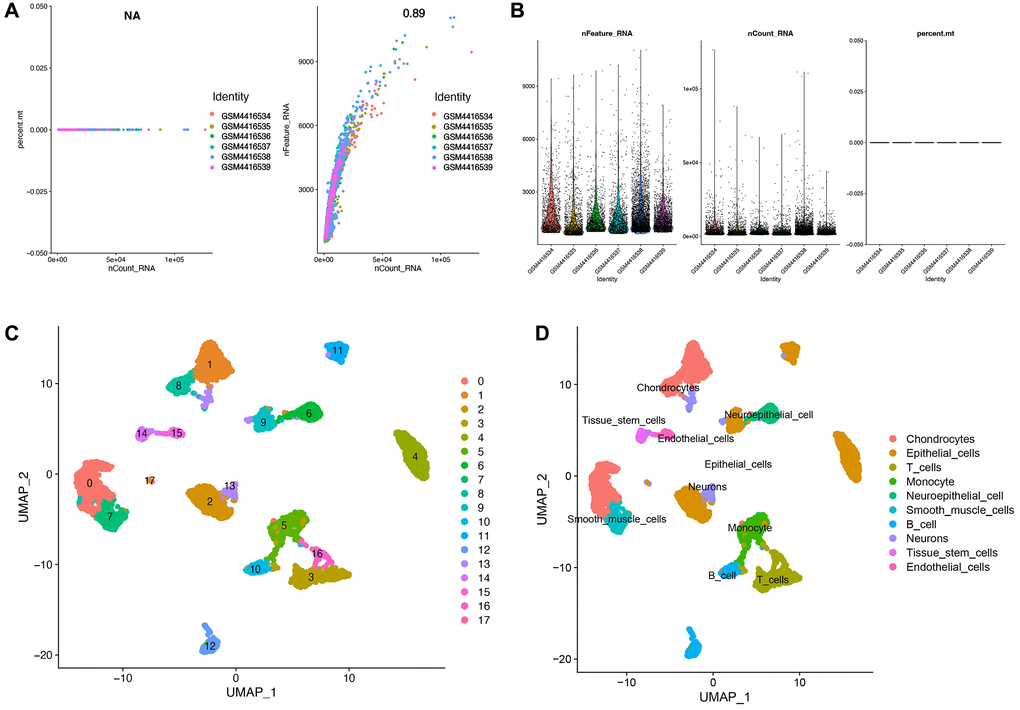
Figure 2.Identification of T cell-related markers in ovarian cancer. (A) Post quality control filtering of each sequenced cell. (B) Association analysis between nFeature and nCount. (C) A total of 17 clusters of all samples were identified after UMAP analysis. (D) A total of 10 subtypes of cells were identified based on SingleR annotation methods.