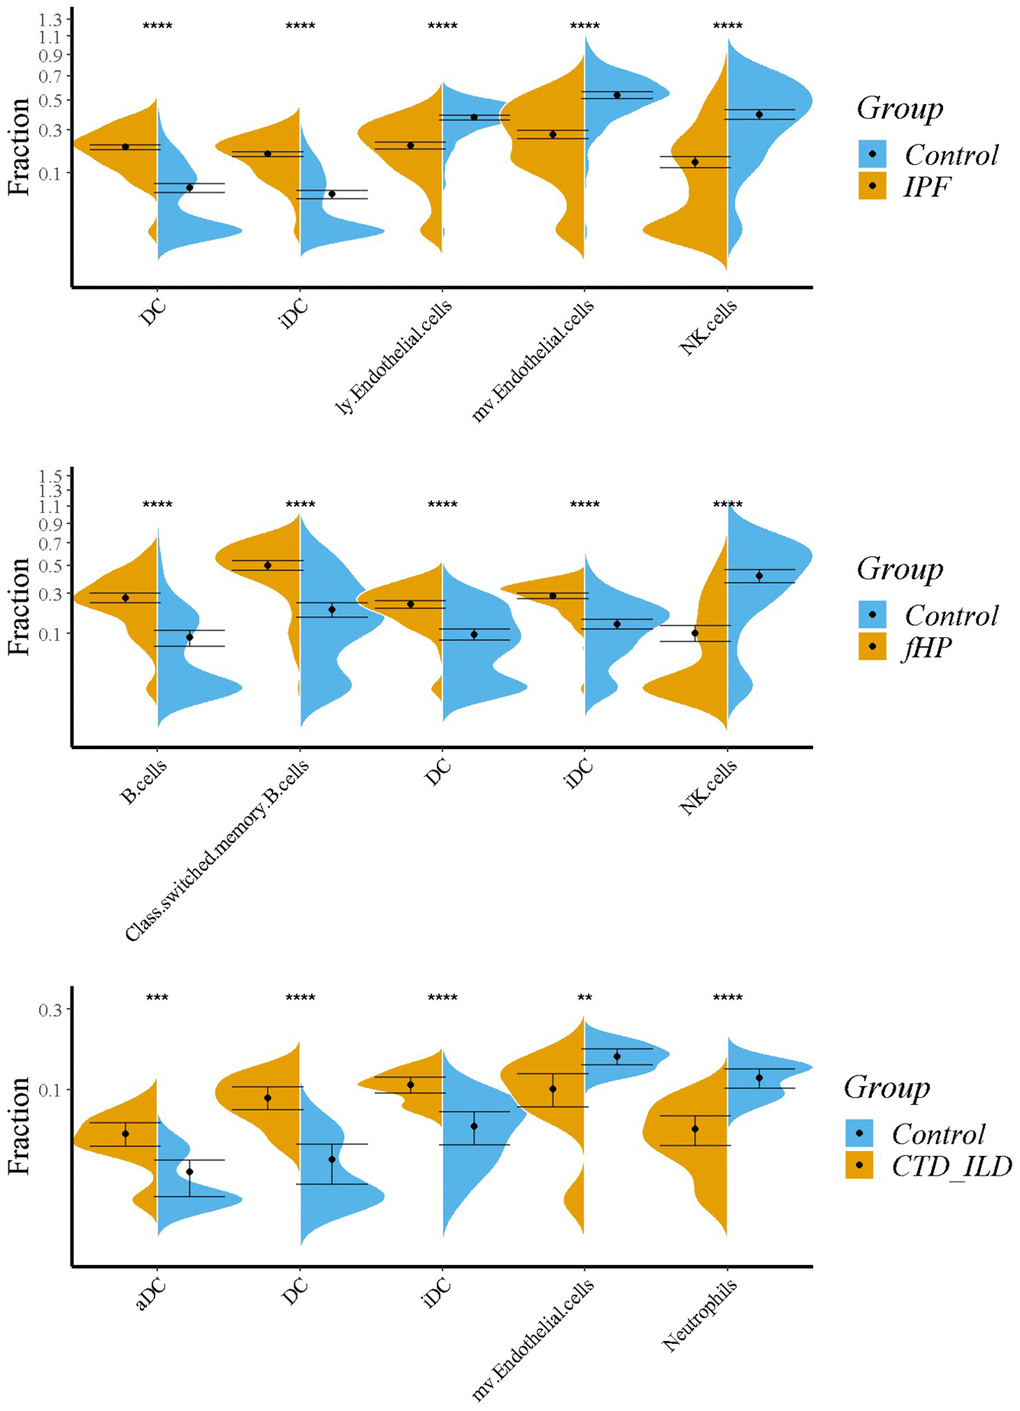
Figure 8.Immune infiltration analysis by xCell. Violin plots showing the comparison between 3 ILDs and healthy controls. Top 5 significant variations in immune cell proportions were shown. ns: P ≥ 0.05, *:P < 0.05; **:P < 0.01; ***:P < 0.001; ****:P < 0.0001.