Submit an Article
Navigate
Home
Editorial Board
Editorial Policies
Current Volume
Archive
Scientific Integrity
Publication Ethics Statements
Interviews with Outstanding Authors
Newsroom
Sponsored Conferences
Podcast
Contact
Special Collections
Submit an Article
Online ISSN: 1945-4589
Research Paper
|
Volume 16, Issue 3
|
pp. 2953–2977
Overexpression of
SPP1
is a prognostic indicator of immune infiltration in lung adenocarcinoma
Back to article
Figure 9
(9 of 9)
−
100%
+
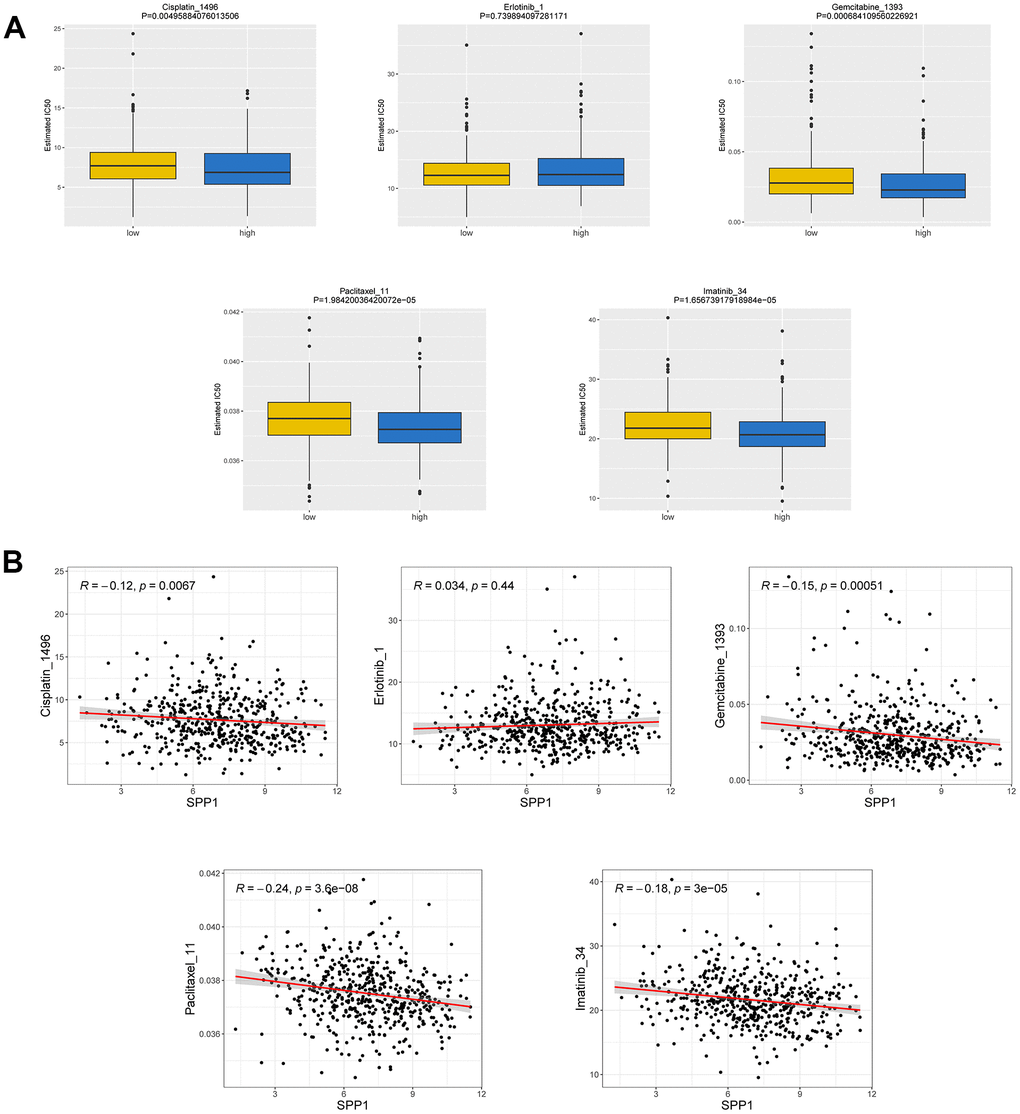
Figure 9.
Correlation between drug susceptibility and SPP1 expression.
(
A
) IC
50
difference between groups with high and low expression of the SPP1. (
B
) Relationship between IC
50
and SPP1.