Submit an Article
Navigate
Home
Editorial Board
Editorial Policies
Current Volume
Archive
Scientific Integrity
Publication Ethics Statements
Interviews with Outstanding Authors
Newsroom
Sponsored Conferences
Podcast
Contact
Special Collections
Submit an Article
Online ISSN: 1945-4589
Research Paper
|
Volume 16, Issue 4
|
pp. 3185–3199
The high expression of TOP2A and MELK induces the occurrence of psoriasis
Back to article
Figure 5
(5 of 8)
−
100%
+
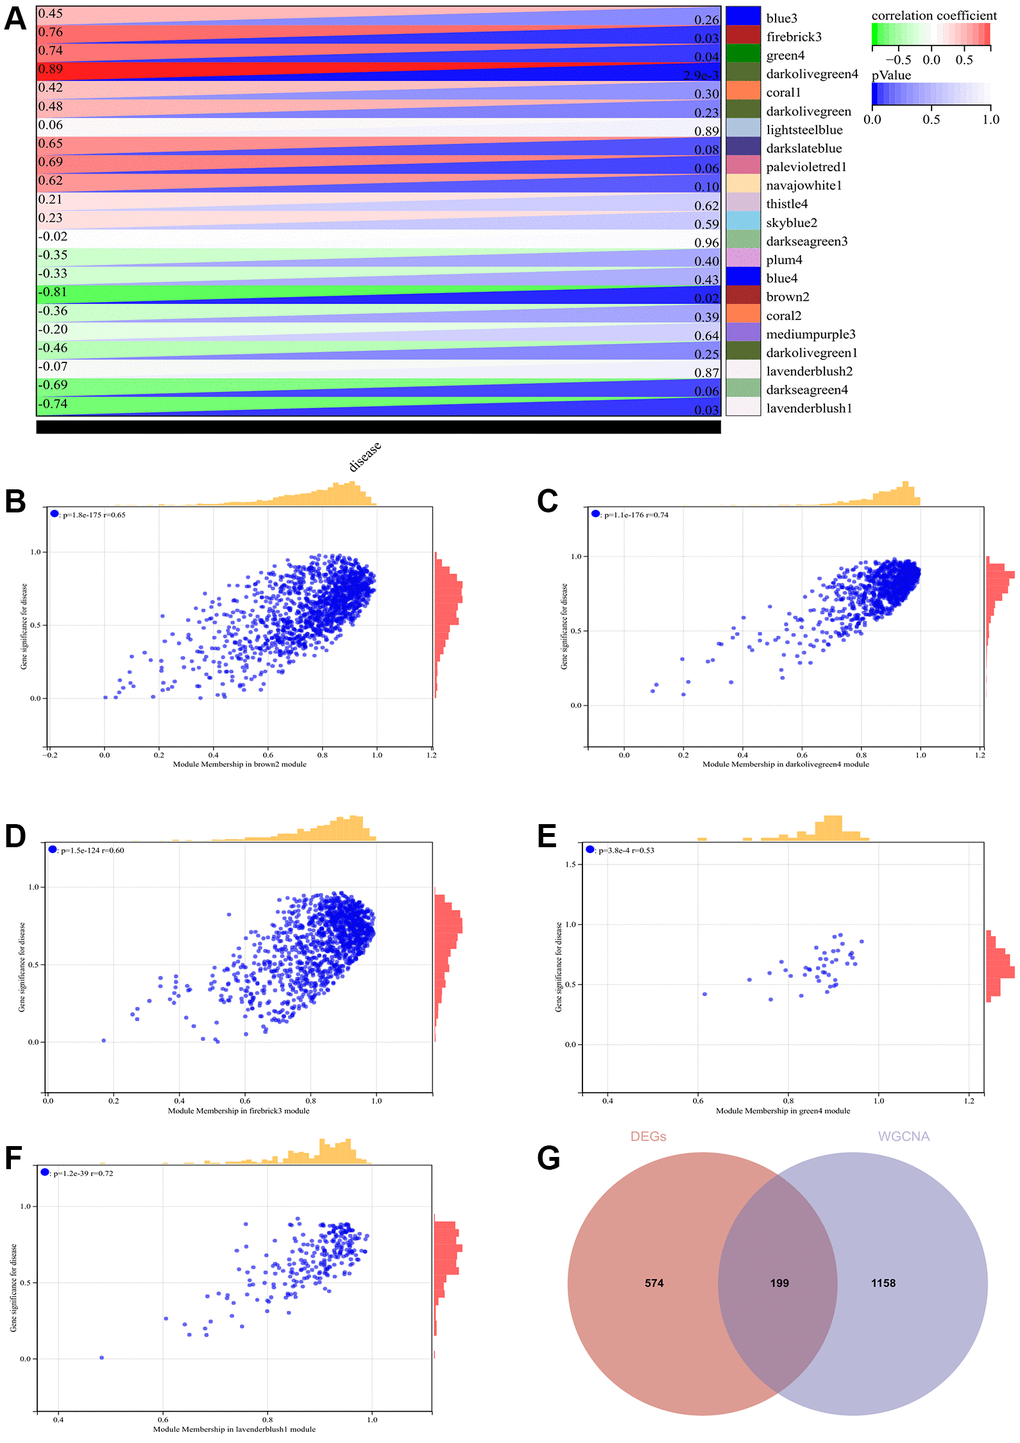
Figure 5.
WGCNA.
(
A
) Heatmap of module-trait correlations. (
B
–
F
) Scatter plot of correlation between GS and module membership (MM) for relevant hub genes. (
G
) Venn diagram illustrating the intersection.