Submit an Article
Navigate
Home
Editorial Board
Editorial Policies
Current Volume
Archive
Scientific Integrity
Publication Ethics Statements
Interviews with Outstanding Authors
Newsroom
Sponsored Conferences
Podcast
Contact
Special Collections
Submit an Article
Online ISSN: 1945-4589
Research Paper
|
Volume 16, Issue 5
|
pp. 4149–4168
Complementary biomarkers of computed tomography for diagnostic grading of gastric cancer: DSCC1 and GINS1
Back to article
Figure 5
(5 of 13)
−
100%
+
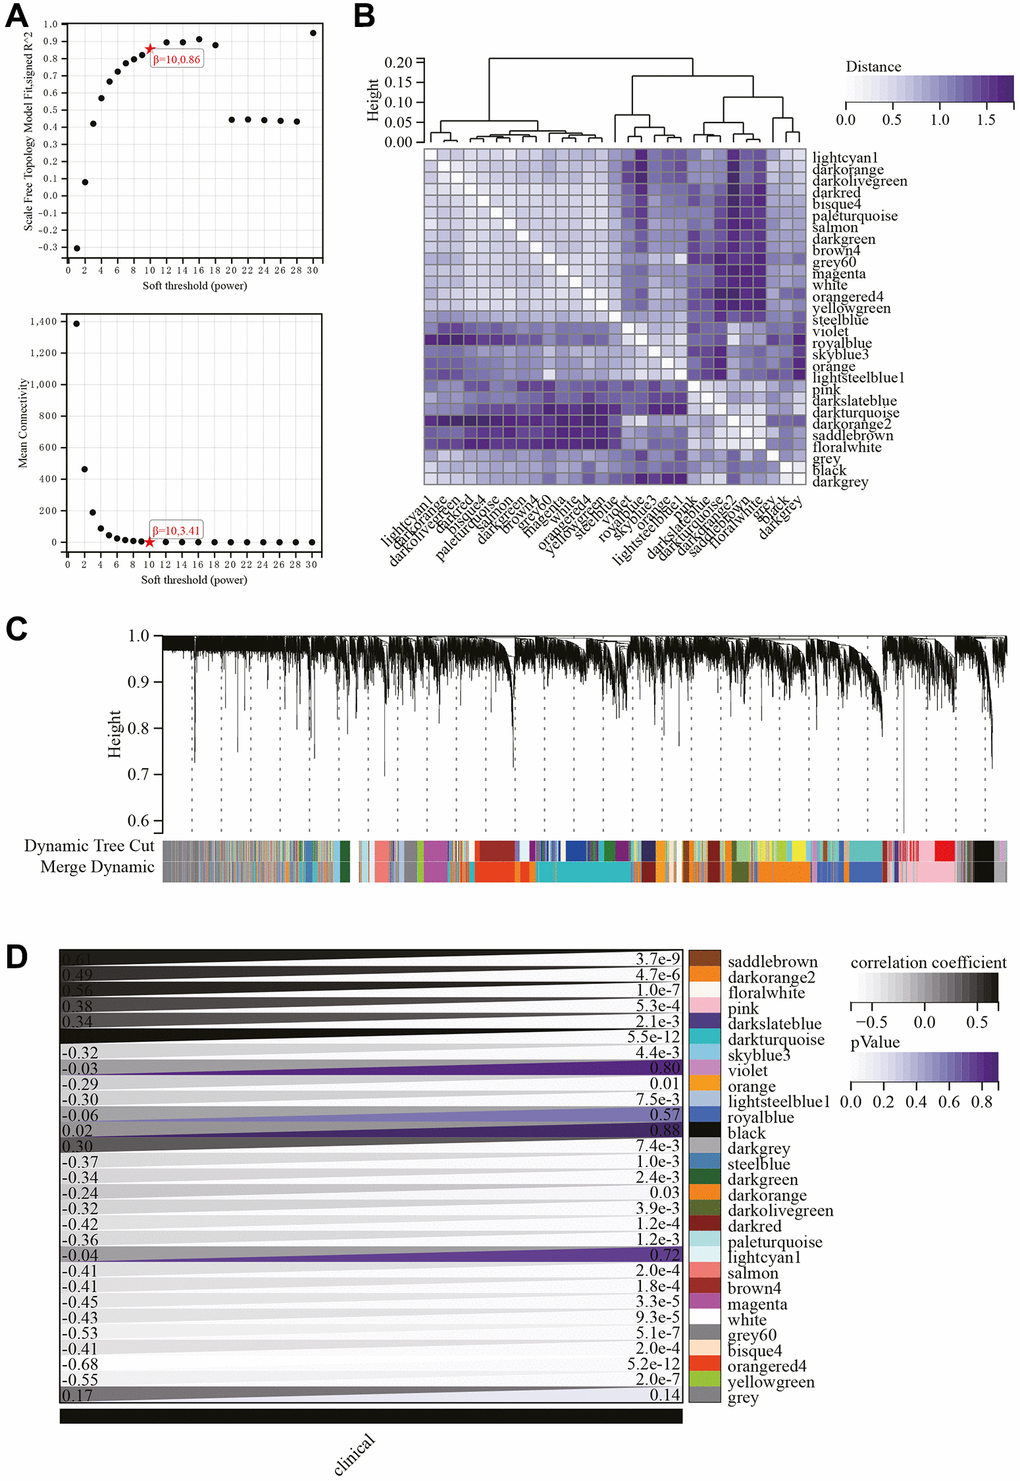
Figure 5.
WGCNA.
(
A
) β = 10, 0.86, β = 10, 3.41. (
B
) Gene hierarchical clustering tree. (
C
) Generated 29 modules. (
D
) Heatmap showing the correlation between modules and phenotypes.