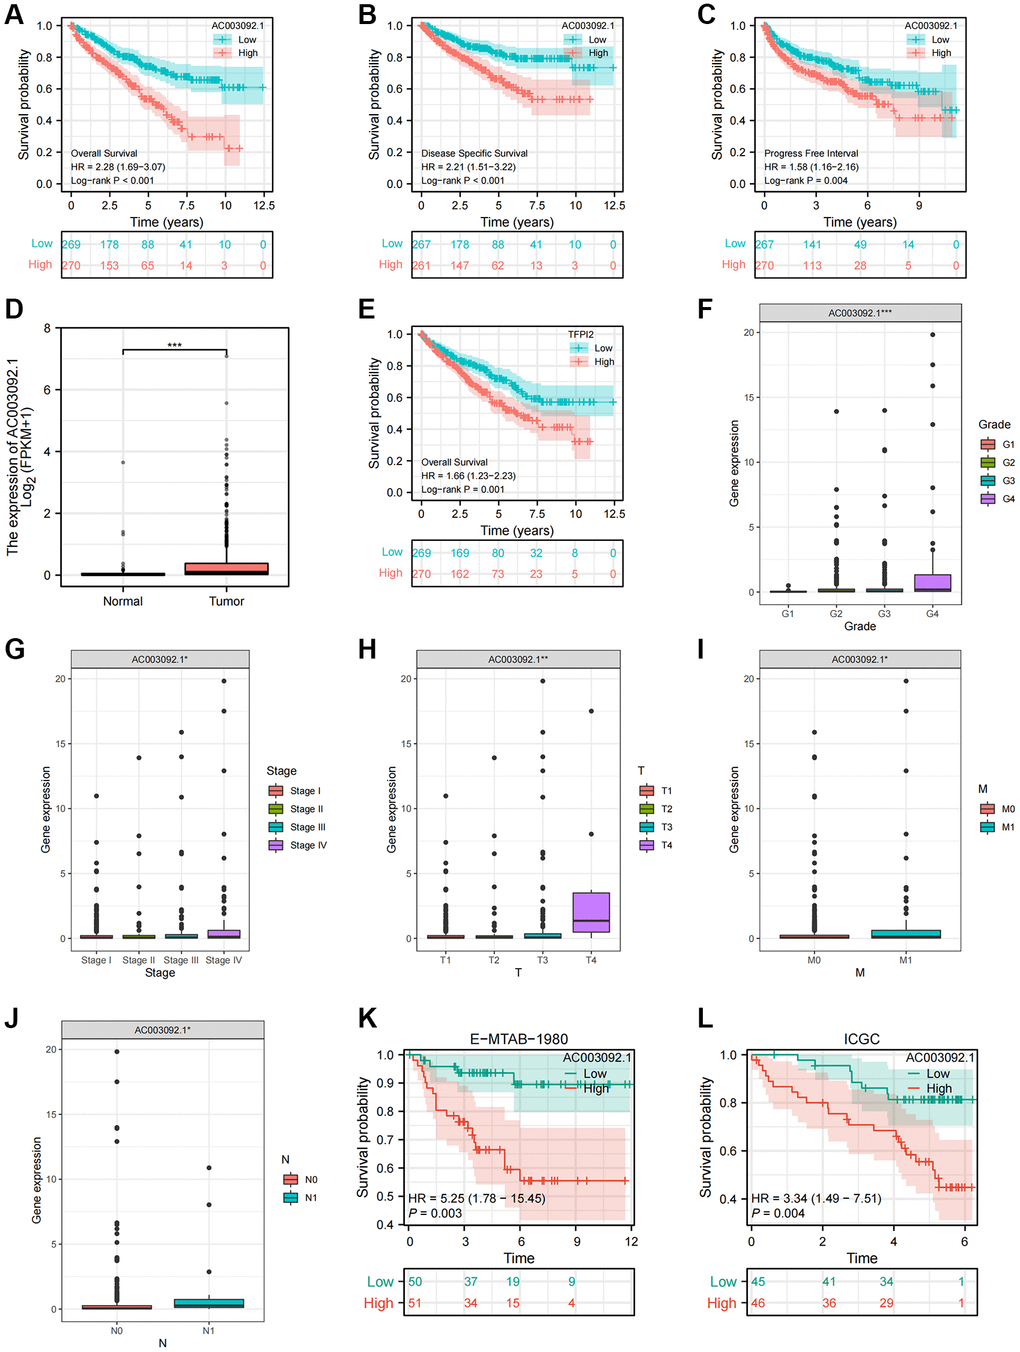
Figure 5.Clinical and prognostic characteristics of AC003092.1 in ccRCC. (A–C) KM survival curve showing the survival differences between high and low AC003092.1 groups (A: OS; B: DSS; C: PFI); (D) Difference of AC003092.1 mRNA expression between ccRCC and adjacent tissues; (E) KM survival curve showing the survival differences between high and low TFPI2 groups; (F–J) Differences of AC003092.1 expression in different clinicopathological variables (F: Grade; G: Stage; H: T stage; I: M stage; J: N stage); (K, L) KM survival curve showing the survival differences between high and low AC003092.1 groups in the E-MTAB-1980 and ICGC datasets.